By Applied NanoFluorescence LLC
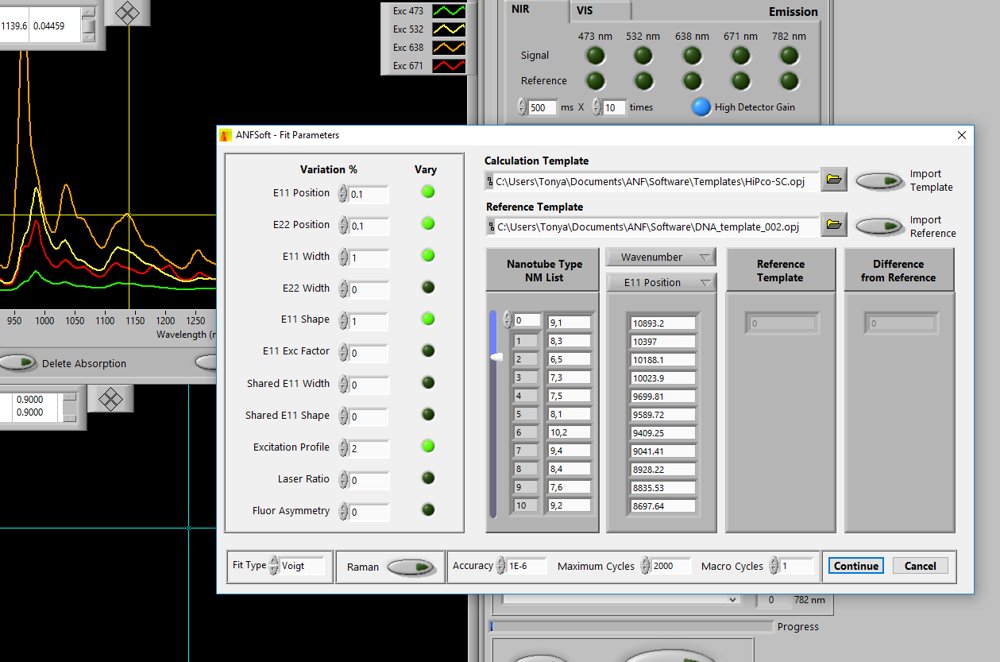
Application Note 3: Fitting Parameters Guide and Definitions for NanoSpectralyze Peak Fitting Software to Calculate Relative (n,m) Distribution in Fluorescence Single-Walled Carbon Nanotube Samples Overview A general approach to spectral fitting with a new sample is first to load the template intended for or most similar to that sample’s surfactant. A Quick Fit should be run to see how accurate a simulation is obtained with the default parameter values of that template. If improvements are needed, a Full Fit analysis should be run with some of the above parameters allowed to vary (the recommended parameters to vary and typical percent variations are shown in Table 1). As the fit quality improves, fix some of the parameters that had been varied and allow new ones to vary. Some iteration of this procedure may be needed, but it is often possible to reduce the MSD (mean standard deviation)value to ~0.005. Once a satisfactory high quality fit has been obtained, save the parameters as a new template that will reflect the environment and history of the analyzed sample. Subsequent analyses of similarly prepared samples can then be very quickly computed using this template, with little or no need for parameter variation. The current version of the fitting software allows user choice of symmetric (Voigt) or asymmetric (Pearson) line shapes to simulate the main emission peaks. Pearson is generally recommended for the most realistic results. Note, however, that templates are specific to this choice: Voigt and Pearson templates are not interchangeable and the E11 Width and E11 Shape parameters are linked to the choice. Each template is automatically coded as Voigt or Pearson, and the value appears in the Fit Type text box in the lower left hand corner of the Fit Parameters window when a template is imported. When analyzing samples grown or prepared through different processes, a subset of the fit parameters should normally be allowed to vary slightly to account for the effects of sample condition and environment. Table 1 below lists those parameters and the recommended variation limits (in % per fitting round) to enter into the Fit Parameters Dialog Box. Table 1. Fit parameters suitable for user control, with recommended variation limits Parameter Name, Typical Variation %, Notes E11 Position 0.1 Accounts for spectral shifts from SWCNT environment E22 Position 0.1 Accounts for spectral shifts from SWCNT environment E11 Width 3 Accounts for environmental homogeneity differences E11 Shape 6 Accounts for environmental homogeneity differences Excitation Profile 5 May change with sample condition and environment The meanings of these fit parameters are described in the following paragraphs. The fitting process can be restarted from the last set of parameter values by select Calculate again on the Fit screen. In these subsequent fitting rounds, parameters are again freed to vary by the range specified in the Variation % fields. Therefore running five consecutive fitting rounds with a 10% allowed variation in some parameter can lead to a much larger cumulative variation of ~50%, which may be unrealistic. Keep this potential problem in mind and be conservative when setting variation limits. Note also that the fitting routine searches for a local optimum in a multidimensional parameter space. Decreasing the number of varied parameters will greatly accelerate convergence, and decreasing the range of allowed variation for those parameters that are well pre-determined will also speed the fitting computations. Because of the large number of parameters, a converged solution will not be unique. Reliability of the final results will be limited by the care taken in the fitting process and also by approximations in the spectral model used for simulation. User-adjustable Fit Parameters: E11 Position (typical adjustment range: ≤ 0.1%)is the set of (n,m)-specific frequencies, in cm-1, for the main emission peaks (first van Hove transitions). The array size is equal to the number of SWCNT types used in the fitting. There are an equal number of values for E22 Position, E11 Width, E22 Width, E11 Shape, E11 Exc Factor, and Solution Vector, as each of these is considered (n,m)-specific. E11 Position values can vary with SWCNT perfection, surfactant coating, other environmental conditions, or (sometimes) the sample preparation protocol. When using a set of frequencies that is appropriate for the relevant surfactant, only slight variations (within ~0.05-0.1%) should be permitted for E11 Position. Caution: larger tolerances may lead to fits that appear accurate but misidentify some peaks. E22 Position (typical adjustment range: ≤ 0.1%)is the set of (n,m)-specific frequencies, in cm-1, for the peak absorption features (second van Hove transitions). Because these features are broader than emission peaks, their parameter values are somewhat less critical than the E11 positions and may be safely allowed to vary by ~0.1%. E11 Width (typical adjustment range: ≤ 3%)is the set of (n,m)-specific individual peak widths (FWHM, in cm-1) for the emission features. During initial fitting of a sample without a refined template, it is recommended to use the Shared E11 Width parameter instead. This will prevent individual peak widths from assuming anomalously small or large values. After a rather refined fit has been obtained with Shared E11 Width, spectral fitting can proceed with individual width variations using the E11 Width parameters. Here, variations of ~3% per round may be safely allowed, but after a few rounds the values should be checked and corrected to avoid unreasonable broadening (most frequent problem) or narrowing of the component peaks. We recommend examining peak contours in the Simulated Contour Plot display (see Fig. 19) and being suspicious of width parameter for any peaks that do not look nearly circular in this display. E11 Shape (typical adjustment range: ≤ 10%)If Voigt peak shapes are selected, the E11 Shape parameters are a set of (n,m)-specific ratios that describe the balance of Lorentzian and Gaussian components (widths) used to represent the emission line shapes. A value of 0 gives a pure Gaussian shape, and a value of 1 gives a pure Lorentzian shape. It is possible to allow variations of ~10% in these parameters, but a smaller range will accelerate the search for other parameters. Manual adjustment of these values after a few calculation rounds may be required to avoid “sticking” at unrealistic values of 0 or 1. If Pearson peak shapes are selected, the E11 Shape parameters can have any positive whole number value. A value of 1 gives a Lorentzian base shape, whereas large values lead to a near-Gaussian shape. However, these Pearson peaks will be asymmetric, unlike Voigt peaks. Caution: if the simulation model is switched between Voigt and Pearson, major adjustments will be needed in the E11 Shape parameters and also in the E11 Width parameters. Excitation Profile (typical adjustment range: ≤ 10%)is a set of common parameters used in modeling the vibronic structure of excitation spectra that are not available from empirical results (in the file Excitation Profiles in the ANFSoft folder). These parameters can be varied by up to 10% during exploratory fitting. In addition to these parameters, there are others listed in the Fit Parameters Dialog Box that should remain fixed for normal fitting. The parameters below should be allowed to vary only with careful attention by experienced operators. Normally Fixed Fit Parameters: E22 Width (recommend 0%)is the set of (n,m)-specific widths (FWHM, in cm-1) for the E22 absorption peaks. By default, these values are found from a research-based empirical expression included in the program. E11 Exc Factor (recommend 0%)is a set of parameters that accounts for the possible excitation of E 11 vibronic sidebands by the lasers. Shared E11 Width (typical adjustment range: ≤ 20%)is a single peak width (FWHM, in cm‑1) used to describe all of the emission features (as an alternative to (n,m)-specific peak widths). Selecting a variation in this parameter disables variations of the E11 Width parameter set described above. A 20% variation range can be allowed in exploratory fitting. The use of Shared E11 Width should be restricted to preliminary fitting of unusual samples for which a standard template is not adequate. Shared E11 Shape (typical adjustment range: ≤ 10%)is a single ratio of Lorentzian to Gaussian character used to model all of the peaks in the emission spectrum (as an alternative to (n,m)-specific peak shapes). Selecting a variation in this parameter disables variations of the E11 Shape parameter set described above. This parameter can be varied rather widely during exploratory fitting but should then be stable within sets of similarly prepared samples. Laser Ratio (typical adjustment range: ≤ 5%) holds an array of N L relative parameters (where N L is the number of excitation lasers) describing the combined laser powers and optical efficiencies at the excitation wavelengths. After fitting, the first value is set equal to 1. Once initially optimized, the Laser Ratio should remain stable for long periods, since it represents a fixed instrumental parameter. However, when analyzing relatively concentrated samples or samples of non-standard geometry, the parameter may need adjustment to account for differing penetration depths of the excitation beams in the sample cell. A variation limit of ~5% per fitting round is recommended using an established template, but a limit of 20% or higher can be used for a new template when the array begins with a set of values equal to 1. Fluor Asymmetry (recommend 0%)applies when the Pearson peak model is selected under Fit Type in the bottom row of the Fit Parameters dialog box. The parameter describes the asymmetry of the main emission peaks and should remain at its nominal value of 0.3 except in special circumstances. Solution Vector is a result, not a user-selected parameter. It shows the set of deduced (n,m) concentrations found through the fitting process. These are the values transmitted to Origin and used to prepare the displayed results graphs and worksheets.
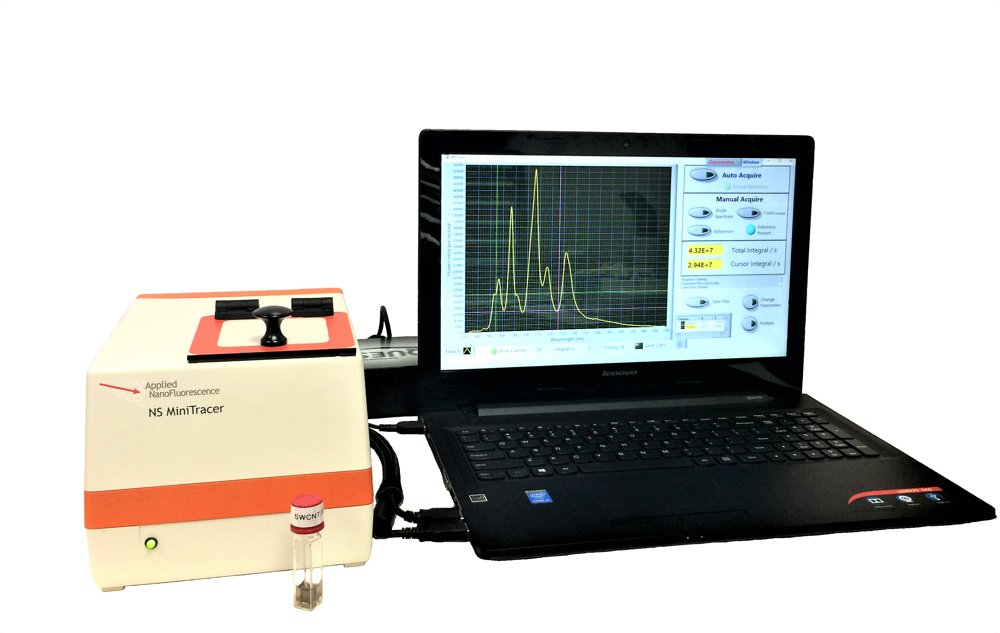
Introducing: The NS MiniTracer The NS MiniTracer is the latest addition to the innovative line of NanoSpectralyzer instruments from Applied NanoFluorescence, LLC. Its design is optimized for fast, easy, and highly sensitive analytical measurements on a variety of samples containing near-infrared fluorophores such as single-walled carbon nanotubes or quantum dots. The MiniTracer is ideal for quantitating SWCNTs in environmental and biological specimens and is also perfect for routine sample characterization in any SWCNT research lab. Features - Most affordable fluorometer for single-walled carbon nanotubes - Quick measurements with user-friendly software - Trace detection down to sub-nanogram levels; lowest LOD and LOQ - Wide dynamic range - Robust and compact design: approximately 165 x 215 mm (~6.5 x 8.5”) - Near-IR emission spectra from 900 to 1600 nm - Optional near-IR absorption spectra from 900 to 1600 nm - Rapid sequence acquisition for kinetic studies or eluent monitoring - Choice of one excitation wavelength The NS-MiniTracer is the newest and most affordable member of the NanoSpectralyzer family. Its robust, compact design includes one excitation laser and optics for capturing the characteristic near-IR fluorescence from fluorophores such as dispersed SWCNTs or PbS quantum dots. Optimized for the lowest possible optical backgrounds, the MiniTracer offers long integration times to provide exceptional detection sensitivity. It is the best instrument available for the selective detection and quantitation of trace amounts of SWCNTs in environmental and biological specimens. Operation of the NS-MiniTracer is also exceptionally easy and user-friendly. Custom software prompts the user to load blank and sample specimens, and automatically selects optimal data acquisition parameters. After acquisition is complete, a full emission spectrum is displayed along with the net spectrally integrated nanotube emission signal. This convenient numerical result is proportional to SWCNT content within a set of samples, and can be used to construct project-specific calibration curves. The NS-MiniTracer is also an ideal tool for any laboratory that needs to routinely characterize their SWCNT dispersions. It quickly captures emission spectra that reflect the composition, concentration, and individualization of a sample’s SWCNTs. And it gives even more spectral information with the affordable near-IR absorption option. Applied NanoFluorescence delivers the NS-MiniTracer as a complete turn-key system including a notebook computer pre-loaded with custom software for instrument control and data analysis. The system carries a full one-year warranty plus free software updates for three years. Please note the images of the instrument and software are of the prototype and the actual appearance may vary. NS MiniTracer Specifications Fluorescence excitation laser: 638 nm, 100 mW standard Other wavelengths available Fluorescence configuration: High numerical aperture epifluorescence Fluorescence spectral range: 900-1600 nm Near-infrared detector type: 512 element TE-cooled InGaAs array Limit of detection: < 10-9 g single-walled carbon nanotubes Minimum sample volume: 120 μL Absorption light source: Stabilized tungsten-halogen lamp Absorption spectral range: 900-1600 nm Absorption spectral resolution: 6 nm Absorption ceiling: 3 AU Absorbance noise (rms): < 2 x 10⁻⁴ AU at 0 AU for 10 s integration Power consumption: 40 W max (excluding computer) Main Module dimensions: 6.5" W x 8.5" D x 5.5" H (165 x 215 x 140 mm) Spectrometer Module dimensions: 7.2" W x 4.3" D x 1.9" H (182 x 110 x 47mm) System weight: 8 lbs (3.7 kg), excluding notebook computer Absorption capability is optional Near-infrared fluorescence spectrum (900-1600 nm) with 638 nm excitation Sequence acquisition of near-infrared fluorescence spectra (900-1600 nm) with 638 nm excitation Optional: near-infrared absorption (900-1600 nm) Sample is a single-walled carbon nanotube suspension in D2O MiniTracer Flyer MiniTracer Specification Sheet Product Catalog
CATEGORY
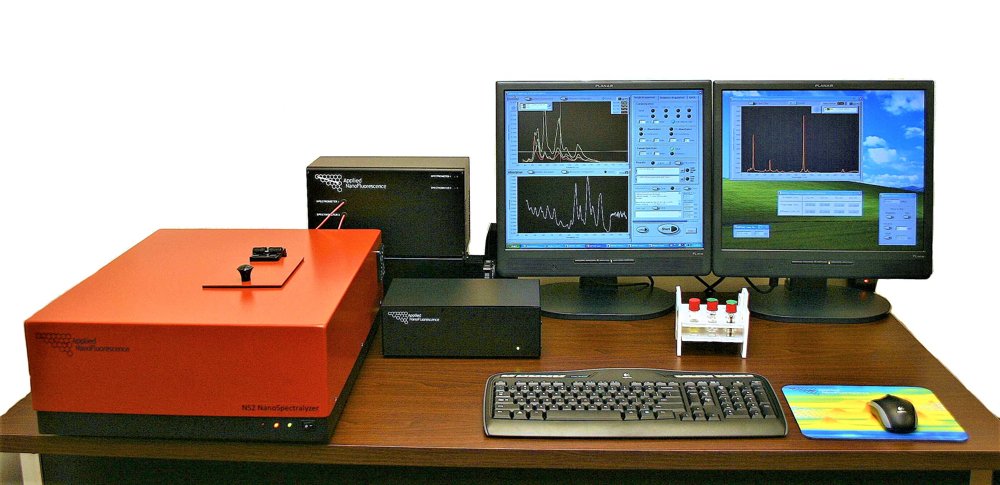
The NS2 NanoSpectralyzer® NS2 is the world's only three-in-one spectrometer for carbon nanotubes. The NS2 provides all of model NS1's state-of-the-art capabilities for analyzing SWCNT samples through near-IR fluorescence and absorption. In addition, the NS2 captures Raman spectra of all CNTs, whether single-walled, multi-walled aggregated, large diameter, or chemically altered. All spectra are automatically measured with a single placement of the sample cuvette. Sophisticated software then performs integrated data analysis to characterize the CNT sample. NS2 Convenience Features - Turn-key system, compact footprint - Quiet operation, low power consumption - Eye-safe CDRH Class 1 laser device - Low maintenance, cryogen-free - Includes computer, software, installation, & warranty - Free software updates for three years NS2 Measurement Features - Multifunctionality (NIR fluorescence, Raman, NIR and visible absorption) - Four lasers for excitation of SWCNT fluorescence emission - One laser for excitation of single and multi-walled CNT Raman scattering - Sensitive near-IR fluorescence detection from 900 to 1600 nm - Raman spectroscopy of RBM, D, G, and G' bands - Rapid absorption spectroscopy from 425 to 1600 nm - Flexible, integrated data acquisition and analysis software - Small sample volume capability - Flow cell compatibility - Kinetics mode for monitoring eluent streams or chemical reactions Our products undergo continuous revision to improve performance and include recent scientific innovations, so instrument and software appearance and options available may change. Additionally, we are happy to work with you to customize many of our products to address specific application needs. NS2 & NS3 NanoSpectralyzer Specifications Fluorescence excitation laser λ: 532, 638, 660, and 785 nm (or customized) Fluorescence geometry: High numerical aperture epifluorescence Fluorescence spectral range: 900-1600 nm Near-infrared detector type: 512 element TE-cooled InGaAs array Raman excitation laser λ: 532 or 660 nm (select when ordering) Raman spectral range: 150 to 3000 cm-1 shift Raman spectral resolution: 6 cm-1 Raman detector type: 2048 pixel TE-cooled Si CCD Absorption light source: Stabilized tungsten-halogen lamp Absorption spectral range: 425-1600 nm Absorption spectral resolution: 6 nm (NIR), 1 nm (vis) Absorption ceiling: 3 AU (NIR and vis) Visible detector type: 2048 pixel Si CCD Absorbance noise (rms), NIR: < 2 x 10⁻⁴ AU at 0 AU for 10 s integration Absorbance noise (rms), visible: < 5 x 10⁻⁴ AU at 0 AU for 10 s integration Minimum sample volume: 120 μL (or 50 μL, optional) Data acquisition time (typical): 2 minutes for full set of spectra Power consumption: 75 W (excluding computer) Main Optical Module dimensions: 18.5" W x 22" D x 7" H (470 x 560 x 180 mm) System weight: 50 lbs/23 kg (excluding computer) NanoSpectralyzer Model Comparison (S= Standard; O= Optional) Near-IR emission: NS1 S, NS2 S, NS3 S Near-IR absorption: NS1 S, NS2 S, NS3 S Visible absorption: NS1 S, NS2 S, NS3 S Raman (1 laser): NS2 S, NS3 O Raman (2 lasers): NS1 O Visible emission: NS3 O Extended NIR emission: NS1 O, NS2 O, NS3 O Extended NIR absorption: NS1 O, NS2 O, NS3 O UV absorption: NS1 O External signal port: NS3 O Laser output port: NS3 O Vertical sample scanning: NS1 O, NS2 O, NS3 O Reduced sample volume: NS1 O, NS2 O, NS3 O Near-infrared fluorescence spectrum (900-1600 nm) with five excitation lasers Visible absorption spectrum (410-900 nm) Near-infrared absorption spectrum (900-1600 nm) Raman spectrum with 671 nm excitation laser Sample is a single-walled carbon nanotube suspension in H2O
CATEGORY
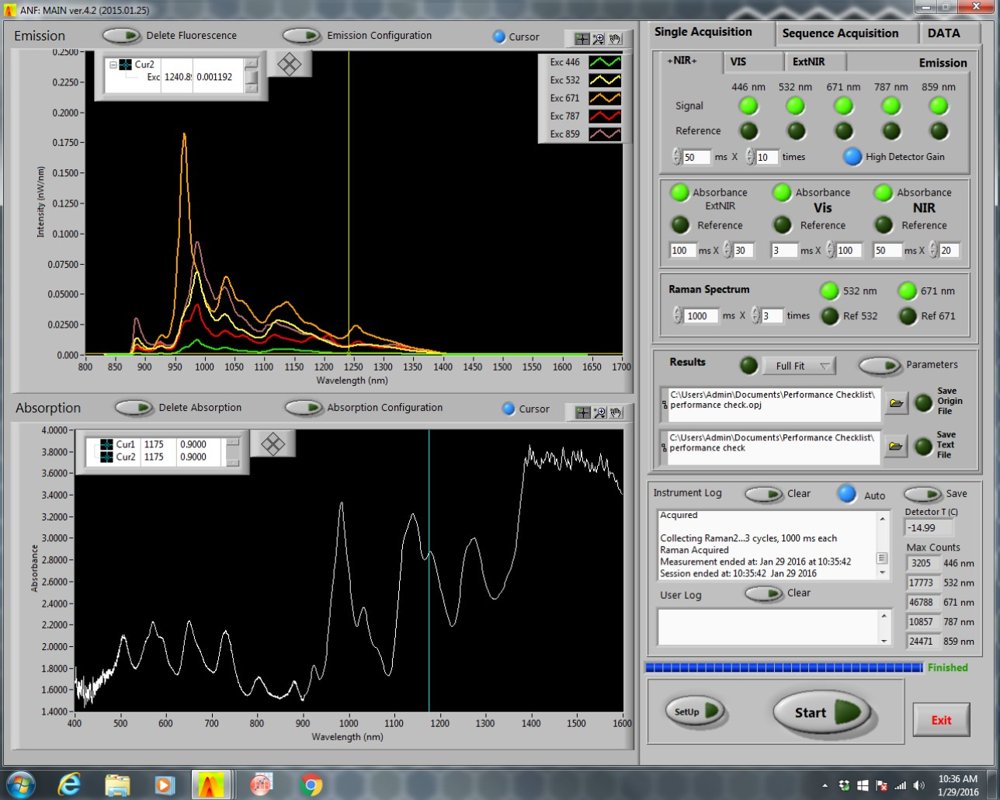
Included with all NanoSpectralyzer models (NS1, NS2, and NS3) The fully integrated NanoSpectralyze software is used for system control, spectral acquisition, and data analysis The main control screen of an NS3 NanoSpectralyzer shows some of the possible modules that can be combined to create a highly customized spectrometer for any nanomaterial research application. Some modules shown as separate tabs on the main control screen include Emission in the Visible, NIR, and Extended NIR with up to 5 different excitation wavelengths; Absorption in the Visible, NIR, and Extended NIR; and Raman with two different excitation wavelengths. NanoSpectralyze software contains custom fitting routines to rapidly analyze the (n,m) and diameter distribution of semiconducting single-walled carbon nanotubes using their NIR fluorescence. Integrated into that fitting routine is the powerful scientific graphing and analysis software, Origin®. NanoSpectralyzer Spectral Modes: Near-Infrared Fluorescence spectra are measured using four or five excitation lasers. Very weak sample emission can be quickly recorded with high signal-to-noise ratios because of the high excitation powers, focused excitation beams, high aperture collection optics, and efficient emission spectrometer and array detector. Absorption spectra are measured in single-beam mode using broadband probing light from a stabilized tungsten-halogen lamp. A 2 mm beam diameter permits the use of small sample volumes. The seamless spectra cover 410 to 1600 nm in all NanoSpectralyzers, with optional UV extension to 210 nm in the NS3. Raman spectra are available only with models NS2 and NS3. The Raman excitation wavelength(s) may be selected (on ordering) as 532 and/or 671 nm, according to customer preference. The optical configuration has been designed to provide a spectral resolution and range appropriate for spectroscopy of carbon nanomaterials (CNTs, graphene, carbon quantum dots). Setup Mode allows full manual control of all instrument parameters and displays raw spectra in real time. This is useful for exploratory research applications and for estimating acquisition parameters for new samples. Time Sequence Acquisition Mode allows any spectral measurements to be recorded as kinetic sequences to monitor changes in sample composition or condition (for all included spectroscopy modes: fluorescence, absorption, and Raman). This mode is ideal for studying nanoparticle aggregation or chemical reactions. If a flow cell is installed, sequence mode also allows the user to monitor nanoparticles in eluent streams. Up to 10 spectra per second can be recorded. Analysis of sets of near-infrared (NIR) fluorescence spectra measured from SWCNT samples are semi-automatically interpreted by a sophisticated software module (NanoSpectralyze) that is part of the NanoSpectralyzer system. This program uses templates containing detailed spectral data on dozens of semiconducting (n,m) species. It accurately simulates the measured spectra to find the set of (n,m) concentrations that account for the observed fluorescence data. This analysis is based on current research findings in carbon nanotube spectroscopy and photophysics. For a more detailed description see the Application Notes. Publication Ready Graphs: Spectral data and analysis results are automatically compiled into an Origin® project file and converted into publication-quality graphs. The graphene sheet plot shows the abundance distribution of different (n,m) species in an SWCNT sample. The relative abundance deduced for each species is proportional to the thickness of its hexagonal border. Results are provided with and without fluorimetric efficiency corrections. Excitation-emission contour plot - The deduced (n,m) distribution is also displayed in the form of an excitation-emission contour plot. This plot is synthesized from the discrete set of measured emission spectra and the parameters deduced from spectral analysis. Histogram plot of the deduced diameter distribution of a SWCNT sample is automatically computed from the (n,m) distribution. The plot also displays the first and second moments of the diameter distribution. Results are provided with and without corrections for (n,m)-dependent fluorimetric efficiencies.
CATEGORY
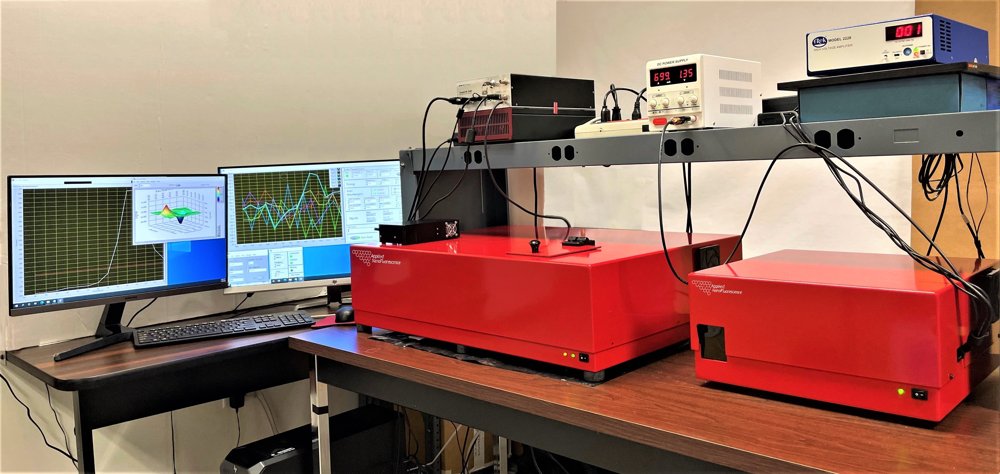
The NS Super Chiroptical System - a unique instrument developed for NIST to measure fluorescence-detected circular dichroism (FDCD) of near-infrared fluorophores. If you are researching right and left enantiomers of single-walled carbon nanotubes (SWCNTs), this is one of the few instruments in the world that can measure a difference. And it is the only instrument that measures 2-dimensional FDCD signals providing a excitation-emission map of chiral signals from a mixed sample of SWCNTs. 2-dimensional FDCD scan of a racemic (6,5) sample displaying peak splitting and a shift of the peak centers as signals of opposite signs are observed for both enantiomers in the sample. Corresponding near-infrared fluorescence excitation-emission scan of the racemic (6,5) sample displaying a single peak at a wavelength centered between the split peaks observed in the circular dichroism signal. The NS Super Chiroptical is a specialized instrument designed to measure chiroptical signals of enantiomers that fluoresce in the near-infrared as a project with NIST. It combines these chiroptical measurements to the NS Super and is configured both for measurements of 2-dimensional fluorescence-detected circular dichroism (FDCD) and rapid-scan excitation-emission scans with continuous visible excitation (500-850 nm) and near-infrared emission (900-1600 nm). This instrument is based on SBIR Phase I & II leading-edge research. For more information please inquire at 713-521-1450 or info@appliednano.com. NS Super - Rapid Excitation-Emission Scans NS Super Chiroptical System Includes: - Continuous variable supercontinuum excitation source from 500-850 nm - NIR emission detection from 900-1600 nm - NIR absorption from 900-1600 nm - Chiroptical spectroscopy modes - 2-dimension Fluorescence-Detected Circular Dichroism measurements (excitation scanned from 500-850 nm, emission scanned from 900-1600 nm) - Traditional FDCD measurements (excitation scanned from 500-850 nm, total near-infrared emission collected) - Wavelength selected FDCD trace (excitation scanned from 500-850 nm, near-infrared emission collected at a single selected near-infrared wavelength) - Single chiroptical emission trace (excitation at a single selected visible wavelength, emission scanned from 900-1600 nm) - User-friendly software Sample data showing 2D FDCD of (6,5)- and (6,5)+samples showing signals of opposite signs and their corresponding excitation-emission scans. Applied NanoFluorescence delivers the NS Super as a complete turn-key system including a computer pre-loaded with custom software for instrument control and data analysis. The system carries a full one-year warranty plus free software updates for three years. Please note the images of the instrument and software are of the prototype and the actual appearance may vary.
CATEGORY
