By Digital Surf
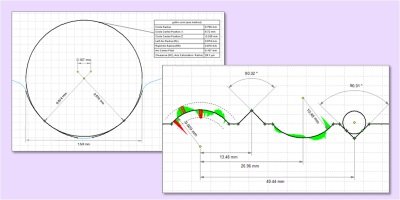
Advanced dimensioning and tolerancing, DXF CAD-compare, Gothic arch and other advanced functions ⇒ Use auto-dimensioning tools to analyze the dimensions of profiles measured on component surfaces – lines, arcs, circles and angles between intersecting tangents. ⇒ Compare profiles with CAD data in DXF format or user-defined nominal form ⇒ Automatic generation of tables of results with data export – export results in Excel-compatible format for quality management systems. ⇒ Graphical display of form deviations – out-of-tolerance deviations are highlighted visually ⇒ Advanced functions – process profiles with variable dimensions – Gothic Arch analysis etc. Included in: - MountainsLab® Premium Available with: - MountainsMap® Profile - MountainsMap® Topography - MountainsMap® Imaging Topography - MountainsMap® Expert - MountainsMap® Premium - MountainsSPIP® Premium - MountainsImage® Expert - MountainsImage® Premium - MountainsLab® Expert
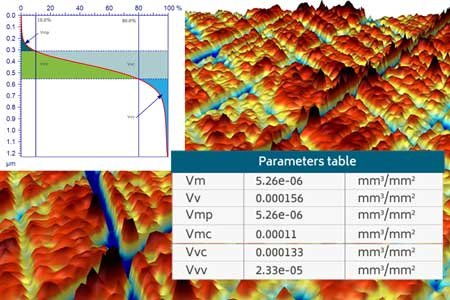
One analysis software solution for all your instrument data. Looking for a comprehensive software suite that can handle all your microscope and profiler data? Look no further than MountainsLab®. Our industry-standard surface analysis solution is the ideal choice for labs of all types, providing a centralized hub for all your instrument data. With our team's extensive expertise and support, you can trust that your analysis will be successful no matter your application. The most comprehensive set of form and surface texture analyses - Particle and pore analysis - Fiber analysis - Statistical analysis of static and dynamic populations - Force curve and force volume analysis - Features for spectroscopy (Raman, IR, EDS/EDX, cathodoluminescence etc.) - Color and topography innovation for scanning electron microscopy - Analysis of multi-channel cubes of compositional data - And much more. Data confluence: Bring together data from multiple instruments (profilometer, microscope); Speed up analysis; Load any document created by other Mountains® users; Process data from virtually any type of surface and image analysis instrument. Compatible with any instrument: Process data from profilometers, light microscopes, scanning electron microscopes (SEM), scanning probe microscopes (SPM) and spectroscopic techniques; Load hundreds of file formats. Correlative analysis: Perform correlative analysis; Use the colocalization feature to combine and overlay data from different instruments; Access advanced rendering options. Surface texture analysis: Benefit from Digital Surf's expertise in surface metrology; Analyze surface texture; Access advanced filters and parameters. Advanced particle & fiber analysis: Detect and quantify particles and fibers on any surface; Benefit from application-oriented segmentation techniques; Group particles into classes based on characteristics; Generate statistics and graphics. Generate statistics: Generate statistics for static or dynamic data populations; Create statistics reports; Let MountainsLab® detect and update data automatically; Graphically display data. Advanced contour analysis: Automatically generate dimensions of profiles; Compare profiles with CAD data or nominal form; Graphically display form deviations. Force spectroscopy: Analyze force curves and force volume; Detect adhesion force, apply Wormlike chain (WLC) models for protein unfolding, generate Young's Modulus map etc. Data processing for spectroscopic techniques: Visualize and analyze spectra, spectral maps and hyperspectral images; Correlate data from spectroscopy with data and images from other instruments; Load multi-channel cubes of compositional data. SEM image colorization: Add color to objects in SEM images in just a few clicks; Automatic object detection; Save time compared with using photo editing software. 3D SEM image reconstruction: Generate 3D surface topography from two successive tilted scans of your sample or several images scanned by a multi-segment detector, all in a matter of seconds. Learn & teach: Access tutorials and ready-to-use templates adapted to each different instrument type; Teach new colleagues about surface and image analysis routines using templates.
CATEGORY
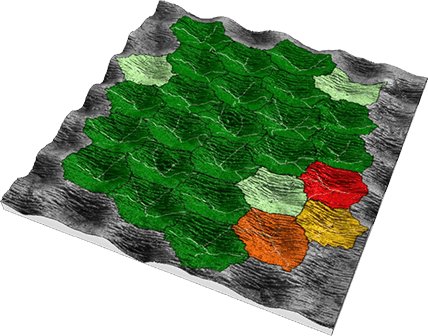
A brand new version of industry's favorite surface and image analysis software has just been released. This latest release sees the update of SmartFlows (formerly known as Minidocs), a key tool for automating data analysis, the enhancement of the ever-popular Particle Analysis tool and many new options for users analyzing spectra from techniques such as Raman or IR. Minidocs are now SmartFlows (and they make your analysis even faster) What is a SmartFlow? - A SmartFlow (previously called Minidoc) is an analysis sequence that you can save and reapply to other datasets quickly and easily, saving you precious time. - It's batch analysis at its best, no need to write code, just select your favorite sequences and turn them into a SmartFlow in a few clicks. - Your SmartFlows will appear in the ribbon, allowing you to reapply them as quickly and easily as they were created. What's new in 10.1? - Notable interface improvements and smoother usability: the SmartFlow interface has been reorganized and improved. - Batch processing: you can now apply SmartFlows to several studiables at the same time. Particle Analysis tool enhanced The popular Mountains Particle Analysis tool allows users to detect and quantify structures of any size or shape in profilometry or microscopy data. In version 10.1, further improvements have been made to make life even easier for users studying this kind of data. - Contextual ribbon has been reorganized - Direct access to choice of available detection and calculation channels - New method for choosing detection and calculation channels - Use thumbnails to easily visualize and select detection and calculation channels - Easily synchronize detection and calculation channels - Particle classification has been improved - Settings are grouped by parameter (tree structure), improving readability Free Trial: easier access to 30-day extension - 30-day Free Trial extensions are now granted automatically (no more waiting for your request to be approved) - Easier access to help from sales and support during the Free Trial process Support Center accessible via ribbon - The Digital Surf Support Center is now accessible directly via an icon in the Help tab - Users can submit a question, an incident, a suggestion or any other request NB. Feature not available in custom partner products based on Mountains. Other improvements - All operator dialog boxes are now resizable: Mountains saves the last size set and opens dialog in same size at next use - Table of results enhancements: - Choose information to display in the title (name of study, studiable etc.) - Display name of studiable in tables with results on several studiables - Choose to display parameters as abbreviations or with full names - Better visualization of settings via Photo image (realistic) submenu in operator dialog boxes New features for correlation & spectroscopy Better visualization of spectra - Better Z-axis management in hyperspectral image view: optimize visualization for current curve or for all curves or display spectra with a normalized scale - Cursor now more visible - Spectral images: replace non-measured points with zero Many new options have been added to allow better visualization of spectra. More tools for correcting spectra The Correct the baseline operator has been improved, allowing automatic correction of spectra: - Anchor zones: use portions of spectra (polynomial form method) - Use a line or a second order polynomial - Offset the spectrum curve by setting its lowest point to zero (or the lowest point of a selection zone) or subtract a fixed offset value Remove spikes (cosmic rays) from spectra ensuring clean data before proceeding to analysis Several methods are now available for removing spikes from spectral data. Extract spectral regions of interest more easily - Extract non-rectangular (circular or custom) areas of hyperspectral images - Extract several zones at the same time - Apply Sort by a parameter operator to hyperspectral image and series of spectra Alternative method for creating spectral maps from hyperspectral images - New Use spectral bands operator - Users can now create spectral maps from hyperspectral images using cursors to define spectral bands - This new operator replaces the Colorized band study - A multi-channel image can be generated as a result studiable allowing further analysis with many useful tools (correction, composite rendering, cube creation, etc.) New ways of creating voxel cubes - Create a multi-channel cube - From several multi-channel images - From a series of surfaces - From several hyperspectral images or from spectral maps (Raman, EDS) acquired at different depths New features for SPM New FFT tool: filter line by line - New operator in FFT toolbox allows users to filter surfaces (or multi-channel images) profile by profile by removing wavelengths (1D FFT filtering) - Useful for reducing scanning noise due to mechanical vibrations or light pollution for example New for force curve data: range indentation - New advanced manual method for indentation analysis - Choose fitting range based on force or separation (absolute or relative values) - Allows better fine-tuning when analyzing complex materials (viscoelastic, biological surfaces) New features for Profilometry Rk: updated parameters & default filter - Rk parameters previously existed in the old ISO 13565-2 standard. They now also feature in the new ISO 21920-2 standard, but under slightly different names, and with a different default filter (robust Gaussian). Mountains 10.1 allows Rk to be calculated according to both standards. - NB. Mountains will automatically suggest an update of documents created with previous versions. Rk & Sk studies: impose scale range for Z - Users can now manage Z-axis settings in Rk and Sk studies - Facilitates comparison of several datasets More tools for series of profiles & surfaces Remove form: save time when removing form from a series of profiles or surfaces, no need to extract each profile/surface! - Extract standard deviation from series of surfaces - Extract deviation from mean surface - On whole series - On individual surfaces in series Volume parameters: automatic limits - Thresholds can now be calculated automatically (based on graphical Rk/Sk method) - Allows better adjustment of thresholds when automating profile or surface analysis or substituting a studiable Result picker: new options in Parameter tables - Centralize filter type in order to apply simultaneously to several Parameter tables (to study the effects of filter type on numerical results) - Use a single template (rather than several templates with several different filters) and select the filter type after applying the template - Easier control of.mnt documents by ActiveX via acquisition software Check the release notes for full details of the v10.1 release (available Nov 2023). Access to this latest release is included in the Mountains Software Maintenance Plan (SMP).
CATEGORY
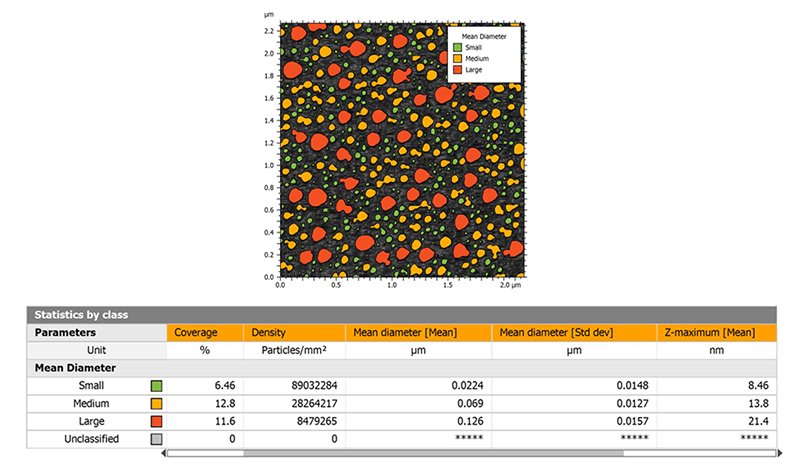
New version 9.2 of Mountains® surface analysis software is here and it comes with many exciting features! Cross-technology features: Keep your document, switch your studiables! - Mountains® unique interactive workflow now allows you to simultaneously substitute several source studiables - Use a document in which an operator or a study is applied on several root studiables (surface subtraction, SEM image reconstruction, colocalization etc.), or when several studiables are contained in a single file (ie. spectral images + mean spectra) Easily access and manage statistics by class - Display statistics by class directly in the Particle Analysis study to compare different particle populations in the same sample - Choose which parameters and which statistics to show - Compare values from different particle classes using statistical parameters (average, standard deviation etc.) - Parameters table is interactive = click on a class or sub-class to display its colors and legends in the particle visualization, choose to delete particles of one or several classes - Compositional analysis: obtain coverage for each class (element) Improved Grid view - When working with multi-channel files (series, AFM datasets etc.), choose the channels you want to show using the checkboxes - Synchronized zoom feature allows you to dynamically visualize the same region of interest at the same time on each channel - Get more information and a better visualization of your multi-channel data: manage axes, show graphical scale, color-scale for Z-axis etc. Profilometry/Surfaces & Profiles features: A new toolbox for analyzing thickness - Align any two studiables to create a “thickness pair” using manual or semi-automatic tools - Analyze thickness (between an upper layer and a lower layer) - Generate global thickness parameters (mean thickness, minimum/maximum, standard deviation etc.) - Calculate parameters at a specific point, along a line or over a zone - Define maximum and minimum thickness limits and easily identify zones that are out-of-limits (useful for applications where constancy of thickness is important: varnish, coatings, sealing membranes etc.) - Generate stunning 3D thickness visualizations - Cross-section them to get two-profile 2D analyses of membranes with interactive measurement Visualize & analyze wear & deposit - Quantify wear and material deposit - Evaluate surface change over time by comparing two successive topography measurements of the same zone - Generate global parameters (projected area, volume etc.) - Calculate parameters at a specific point, along a line or over a zone - Define maximum and minimum limits and graphically visualize zones that are out-of-tolerance - Generate stunning 3D views of wear and deposit and animate them - Cross-section them to get two-profile 2D analyses with interactive measurement New Bandpass-filter bank operator - Apply multiple bandpass filters with increasing cut-offs on Profiles and Surfaces - Characterize samples at different wavelengths and correlate with surface function New tools for Contour Analysis - Exclude defects on components from calculations on Contour Profiles using new robust fitting method - Fit a circle with a fixed radius value when comparing with nominal form - New Settings dialog button improves usability Profilometry/Shells & Point Clouds features: Automatically level Surfaces extracted from Shells or Point Clouds - Save time by letting Mountains® apply best-fit leveling to surfaces extracted from Shells or Point Clouds - Useful for analyzing roughness on hard-to-reach parts (for example on an additive manufactured part imaged using tomography) New Fit form operator - Fit a geometric form (plane, cylinder, sphere) on a Shell using Least squares method - Visualize the resulting Shell with a color scale indicating form deviations Mesh point clouds quickly with new automatic mode - Faster meshing of point clouds with higher quality results More options for remeshing and optimizing Shells - Improved mesh optimization eliminates unnecessary points on flat zones, thus lightening file size and subsequently allowing quicker calculation times Generate a Surface+Image studiable from a Shell containing color information - New option in Extract surface operator - Allows even better rendering and subsequent access to image analysis tools Better fluidity between Shells & other studiable types - Convert surfaces to Shells and access Shell analysis features (ie. curvature calculation) - Convert Shells to Point Clouds Correlation & spectroscopy features: Colocalization: improved automation & new tools for correlative studies - Thumbnails allow better identification and selection of different elements - See overlays even if they are positioned outside the colocalization background - New menu gives clearer access to positioning methods - Access axis settings when performing colocalization: - choose absolute or relative X/Y coordinates to better highlight features - access Z-axis settings in the case of topography Easier navigation when working with multi-channel data - Switch easily from composite mode (several channels) to single channel mode to visualize only parts of data which matter to you Chemical images: set minimum value to zero when thresholding - Eliminate noise by setting baseline value to zero - Useful for calculating spectral intensity values Scanning Probe Microscopy features: Calculate derivatives on IV curves and spectra - Use new Calculate derivatives operator on IV curves and spectra to calculate first and second derivatives - Quickly view the new calculated signals in the Result view - Generated derivative signals or initial and derivative signals can be exported as studiables - Can be used to compare measured curves with calculated mean curves Adjust Z-offset - Shift all absolute Z-values with a constant (set a Z-reference at a user-defined height) - Allows users to calculate heights from a reference and improves comparisons between studies (e.g. Particle analysis) - Developed for SPM users but can be used on data from other instrument types
CATEGORY
With many new and improved features, Mountains® 9.3 will be on show at the Materials Research Society Fall Meeting & Exhibit in Boston, USA from November 29. The new version will also be available for download from mid-November. Cross-technology features: Personalize how you load your data - For users who frequently use the same analysis tools - Save time by choosing to display data directly in your desired Study format (particle analysis, step height, histogram etc.) - Choose whether or not to show studiables in the document (or only in the workflow) Automation features boosted In Industry 4.0, manufacturing is highly automated and directly integrated with surface metrology. Mountains® automation features continue to allow users to efficiently perform batch processing (in particular when integrated as a COM component). New features: - Use Result pickers to manage Tolerance limits - Better automation when working with variables - When variable is changed, all tolerance limits are updated - In Template mode: - Save disk space by choosing not to save generated documents - Manage long file names - Access Result pickers when using Particle Analysis - Recall values calculated elsewhere in the document and use them as thresholds for particle detection - Allows greater flexibility in automated processes - Improved usability of multiple substitution The result picker allows users to pick a numerical result in the Result Manager (generated by a study or entered in a variable) and use it as a setting. Aggregate series of results in statistical documents - Visualize individual series values in statistical documents - Calculate statistics on all individual results of aggregated populations - Particle analysis: sort aggregated series based on classes - Display all individual values in an aggregated series as control charts, histograms etc. - Simplify post-analysis statistical processing - Display number of valid values - Export only valid results from Series Improved tools for FFT-based analysis - Filtering on surfaces and profiles: filter wavelengths directly (low pass, high pass, band pass & band reject), refine excluded/included frequencies more easily, visualize cursor coordinates for wavelength & angle, highlight low or high amplitude frequencies using new Z-scale option (square root, power) - Thresholding: define included magnitude bands with new threshold slider, automation made easier Colocalization: improved positioning - Access positioning methods in the first step of the Colocalization process, and modify if necessary - Incorrect positioning warning now displays if XY offsets of datasets to be colocalized are very different - Colocalize datasets with incompatible offsets using new “Center on background” option New Analysis Workflow hack - New Collapse/Expand All arrows in Workflow - Workflow display now entirely customizable! SPM features: Use advanced FFT to define unit cell size/geometry - Accurately fine tune unit cell size and geometry of a surface with repeating patterns using the new “Adjust unit cell” tool - Automatically recalculate the suggested unit cell when source studiable is modified - Choose to display X/Y linearity errors curves NB: The Lateral calibration Study has been renamed “Lattice and lateral calibration”. Force curves: stiffness analysis & other new tools - Analyze material stiffness and characterize resistance to deformation - Convert a Force-Volume dataset into a Series of force-curves in order to combine and/or compare data - Additional options for displaying and manipulating information on force curves and force volume datasets New tools for IV curve analysis - Multi-signal view: - compare several IV curves (e.g. forward/backward) simultaneously, display signals with a common Z-scale - thumbnails have been added for easier navigation - Cursor navigation on IV images - New “Convert into a series” operator SEM features: Analyze fiber morphology in SEM images Feature available January 2023 - Analyze SEM images (SE & BSE modes) and optical microscopy images - Main applications: nanofibers, electrospun fibers, natural & synthetic fibers etc. - Calculate fiber diameter (mean, min, max, standard deviation) & mean fiber direction - Visualize results on individual fibers and interstices interactively - Display histogram of fiber diameters - Adjust binarization settings to different use-cases (SE, BSE modes etc.) - Export images and numerical results Four-image reconstruction reloaded - Accurately reconstruct topography of images containing objects on a flat background even if slopes 45° (e.g. semiconductors, MEMS, microlens arrays etc.) - Freely choose rotation angle of 4-quadrant detectors manually or let the software find the best angle (e.g. to overcome magnetic beam torsion effects) - Colorize overlaid image layer with 3 colors (as opposed to 2 previously) to highlight details Faster loading of FIB image series as cubes - For Multi-channel cubes generated from FIB-SEM series, loading and calculation times have been largely improved Correlation & spectroscopy features: Improvements for Hyperspectral image visualization - Cursor navigation (see image) - Select any point in the image and visualize the corresponding curve - Display coordinates of the curve and curve number - Edit axes - Multi-signal view - Faster loading of large datasets New tools for analyzing spectra - Normalize spectra (Raman, photoluminescence, cathodoluminescence etc.) - Equalize the importance of different spectrum curves - Choose between different normalization methods (Max intensity, Custom zone, Standard Normal Variate (SNV) for optical spectra, Area) - Convert Hyperspectral images into Series of spectra (e.g. to perform statistical analysis) New features for creating spectral maps - New “Use reference spectra” operator (see below) - Quantify composition of your sample based on reference spectra (components previously extracted from data) - Generate Multi-channel images from Hyperspectral images to improve further data processing. Works with: - Extract components - Create correlation maps NB: The “Create density maps” operator has been renamed “Create correlation maps”. Profilometry features for surfaces & profiles: Metric units in Slices analysis - Obtain volume measurements in metric units (and not only in %) in Slices Analysis - Also: new developed area parameter New grid view on series of profiles - Display all or several profiles in a series side by side - Select number of desired columns and rows Profilometry features for Shells: Unfold cylinders - Unfold cylinders in the “Fit a geometric form” operator - Generate a flat shell representing the unrolled surface of the cylinder - Gain access to analysis features to characterize cylinder surface (surface texture parameters etc.) More options for Shells containing color - Shell colors are now propagated in the Remesh, Rotation and Extract area operators - Image layers can be used as Shell color attributes when converting a Surface+Image studiable How to update A full list of the changes and bug fixes published in this release is available in the release notes. Access to this latest release is included in the Mountains® Software Maintenance Plan (SMP). Please visit our Software Updates page. To find out more about SMP options, please contact sales@digitalsurf.com or visit this page.
CATEGORY
