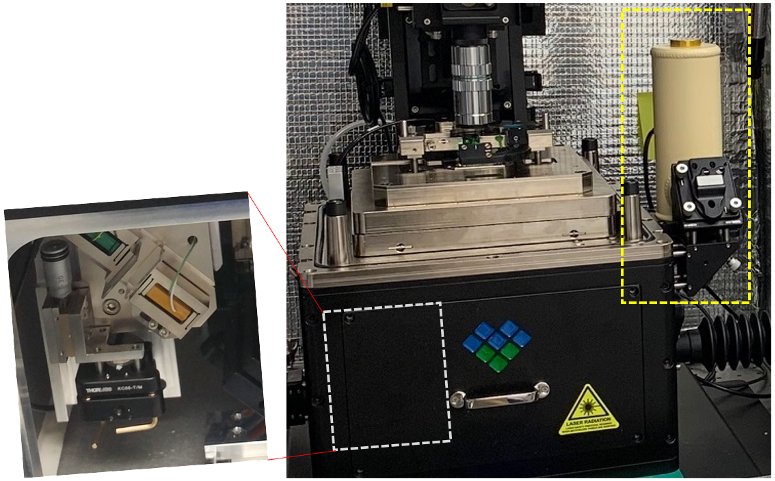
Scattering scanning near-field optical microscopy (s-SNOM), also known as apertureless near-field scanning optical microscopy, which was first demonstrated by Kumar Wickramasinghe and his colleagues at IBM [1], adds a far-field detector to a standard PiFM setup to collect the complex near-field signal (as opposed to via a force sensor as in PiFM). By combining an interferometer, the near-field signal is divided into its real and imaginary component. Figure 1 shows the schematic drawing of the s-SNOM setup. One can see that if the components in the dashed box are removed, the setup is the same as a standard PiFM system; in fact, the components in the dashed box are available as an optional add-on for Vista-IR for those who want to add the s-SNOM capability to Vista-IR. Figure 2 shows the detector (in yellow dashed box) as well as the piezo-driven mirror (in white dashed box) for the reference arm of the interferometer that can be added to Vista-IR at anytime after the purchase of the instrument. Figure 2: Vista-IR with the optional s-SNOM components highlighted. Unlike PiFM, s-SNOM must effectively reject the far-field signal and selectively detect the near-field signal. One effective way to do so is to operate the AFM in tapping mode at f 0 (first mechanical mode) and detect the scattered signal at the harmonics of the driving frequency, nf 0, where n = 1, 2, 3, … Since the far-field should be similar whether the tip is closer or farther away from the surface, and even more so at higher harmonics, a lock-in amplifier (LIA) is used to lock onto the scattered signal at nf 0 to selectively collect the near-field photons. In order to measure the optical phase of the near-field signal, a Michelson interferometer is added to the system as shown in figure 1. The reference arm typically consists of a mirror that is sinusoidally driven (at f M) by a piezo element. When such a reference beam is interfered with the near-field signal, the Fourier spectrum of the interfered signal will consist of harmonic sidebands at frequencies mf M; this is shown in figure 1. Since the signal is spread over several harmonics, lock-in detection on at least one odd and one even harmonics needs to be performed to recover amplitude and phase information. With a judicious choice of phase modulation depth, the other harmonics can be ignored since the two harmonics constitute most of the signal. This method of retrieving the near-field amplitude and phase has been patented and is commonly referred to as "pseudo-heterodyne" technique [1]. Figure 3: Simulated comparison of SNR between GLIA and MLIA. From [2]. MVI uses a different patented technique called Generalized Lock-in Amplifier (GLIA) [2]. GLIA is a specialized digital LIA that utilizes two orthogonal reference signals having the same set of harmonic frequencies that detector sees, namely cos(f R) and sin(f R) where f R = a sin(2pf M t), the applied phase modulation. When the interfered signal is de-modulated with GLIA, amplitude and phase of the near-field signal can be determined precisely and simply as if only a single sideband existed for a standard LIA. A simulated comparison of multiple LIA (MLIA, demodulation at two sideband harmonics in this case) and GLIA reveals that GLIA enjoys at least a factor 2 better signal to noise ratio (SNR) compared to the optimal MLIA method (see figure 3). Figure 4 shows topography, s-SNOM amplitude and s-SNOM phase acquired on hBN using GLIA at 1400 cm-1.Note the effective removal of background interference by GLIA. Figure 5: Topography, PiFM, s-SNOM amplitude and phase acquired on InAsSb-GaSb grating at 1060 cm−1 concurrently. Referring to figure 1 again, Vista-IR can be operated to acquire both s-SNOM (amplitude and phase) and the PiFM data simultaneously since VistaScope comes equipped with multiple LIA along with a GLIA. The optical paths for the interferometer can be matched precisely such that the pulsed quantum cascade laser (QCL) can be used for both PiFM and s-SNOM. Figure 5 shows topography, PiFM, s-SNOM amplitude, and s-SNOM phase acquired at 1060 cm-1 concurrently on an all-semiconductor plasmonic grating, consisting of highly doped InAsSb (upper region in topography) and undoped GaSb (lower region in topography) lines.As both techniques are measuring the near-field response of dipole-image dipole interaction, PiFM and s-SNOM amplitude images agree well.The two techniques are complementary since PiFM provides better sensitivity to the dielectric function variations (as evidenced by features observed in the PiFM image that correlate with topography variations – the rightmost GaSb line is displayed with greater contrast to show the topography variations) while interferometric s-SNOM can provide additional phase information.More on comparing PiFM and s-SNOM can be found here [3]. Given the availability of power in and fast sweep speed of in QCL, one can acquire hyperspectral s-SNOM data, where a s-SNOM spectrum is acquired at each pixel; this is quite similar to hyPIR, where we acquire IR PiFM spectrum at each pixel.
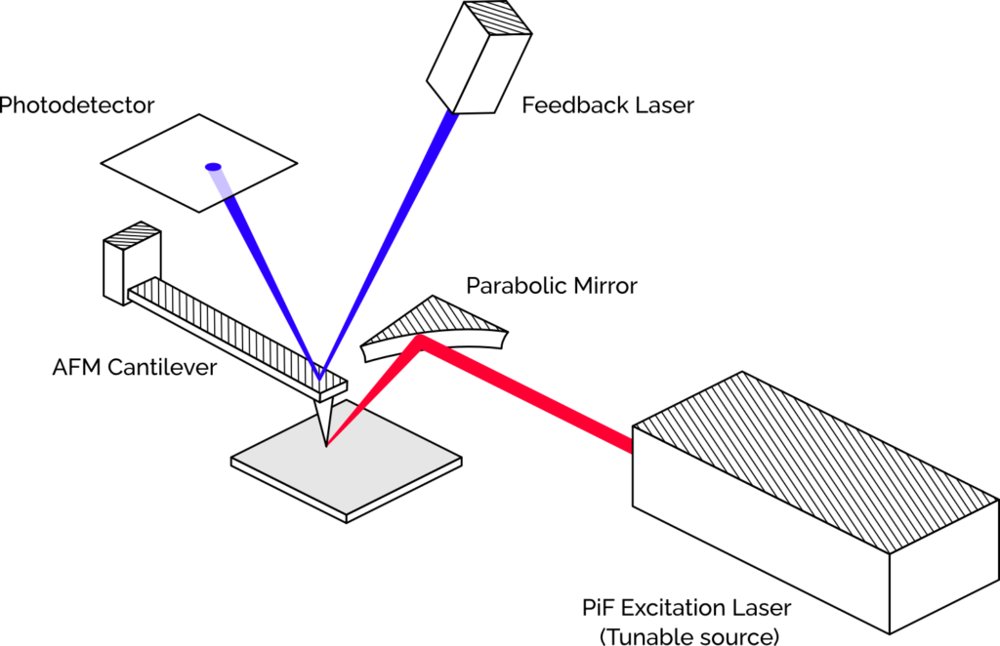
In PiF-IR, a widely tunable narrow band laser is used to excite the sample under an AFM tip. Therefore, PiF-IR is a tunable source technique. Unlike s-SNOM or nano-FTIR techniques the signal is collected using mechanical force detection rather than the optical detection of scattered light. This means that when comparing nano-FTIR to PiF-IR, there are a few inherent advantages in a PiF-IR system. Figure 3. Because PiF‑IR uses a narrowband QCL as a tunable source, the experimental setup is immensely simplified. Furthermore, the near-field signal is automatically isolated because IR measurements are made using mechanical force detection. PiF-IR is both a near-field excitation and near-field detection technique as opposed to the near-field excitation, but far-field detection used for nano-FTIR. Therefore, PiF-IR system is faster, easier to use, and provides better SNR via selective power control. Pi F-IR completely and fundamentally rejects the far-field background signal by its implementation of force measurement, achieving superior SNR. PiF-IR where an even more confined near-field interaction provides a spatial resolution of ~5 nm for a similarly shaped tip. With PiF-IR, on samples that can be damaged by excessive intensity and heating, an attenuator is used to reduce the optical power to as little as 0.5% to 10% of the available QCL power. This can be done selectively in real time for any range of wavenumbers which is especially important for wavelength bands where the sample is highly absorptive. This power notching technology avoids sample damage while maintaining high SNR and short acquisition time. This technology can provide massive improvements to the dynamic range of the system. With photo-induced force microscopy (PiFM), the QCL can be tuned to a wavenumber of interest (usually corresponding to a known molecular transition), and then a full image can be made in a matter of minutes. PiF-IR provides both options—single wavenumber imaging, and hyPIR spectra, which are hyperspectral images that provide a full spectrum at each image pixel. With PiF-IR, although the tunable laser may also have a nonuniform power output as a function of wavenumber, a reference spectrum is rarely needed. Instead, the power profile across the full spectral range can be made to be constant by an active attenuator. This means that there are fewer opportunities for errors arising from improper power normalization, and without the need for frequent reference spectra, data can be acquired much faster (in as little as 15 seconds for a fully normalized constant-power spectrum or 100ms for a digitally normalized spectrum). On the other hand, because PiF-IR uses mechanical force detection, drift is hardly an issue at all. For PiF-IR spectra, there is no thermal drift. When taking a PiFM image thermal drift can slowly shift the imaging region as it does in any AFM – an effect which is minimized by good instrument design. As long as precautions are taken to be aware of any residual drift, and the correct location is being imaged, thermal drift has no impact on PiFM or PiF-IR. PiF-IR uses a QCL with an incredibly narrow spectral resolution of approximately one wavenumber. This means that PiF-IR spectra are extremely detailed to the point where more information can be collected than is possible with conventional FTIR. This opens many possibilities for groundbreaking research. For example, changes in the secondary structures of some proteins can shift a molecular transition by approximately ten wavenumbers, which would be easily detectable in PiF-IR spectra. In general, calculations suggest that PiF-IR measurements are between 100 to 1000 times faster than comparable nano-FTIR measurements.
CATEGORY
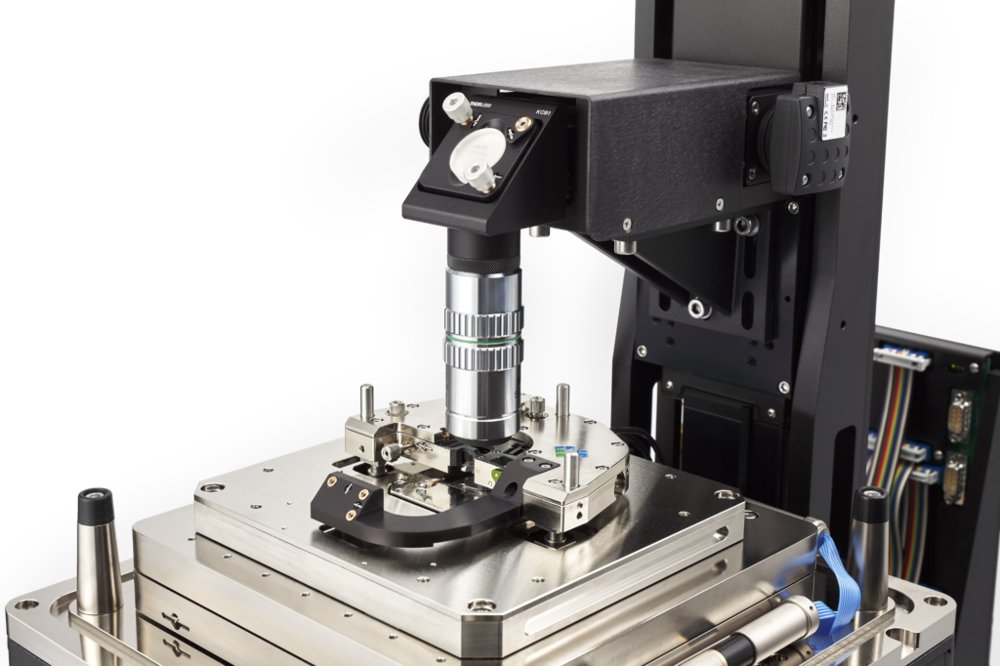
Get the full image using our Vista series nano‑IR microscopes. Featuring photo‑induced force microscopy (PiFM) and photo‑induced force IR spectroscopy (PiF‑IR). Designed for excellence Vista series microscopes Our instruments are the best solution for anyone working with nano‑scale materials, chemistry, or physics.
CATEGORY
