By Math2Market
Modeling fluid dynamics and material behavior across scales GeoApp: Upscaling Relative Permeability In industries such as fuel cell development and oil & gas exploration, accurately modeling relative permeability, i.e. the ability of fluids to move through porous materials, is essential for enhancing efficiency, performance, and resource recovery. However, challenges like limited resolution in 3D imaging resolution, scale-crossing effects, and the need to integrate both resolved and unresolved data make it difficult to fully understand material behavior. This is where Upscaling is becomes essential. The GeoApp enables the combination of micro-scale and macro-scale data to generate accurate, actionable insights across different project scales. It is specifically designed to bridge the gap between small-scale material details and large-scale performance predictions, whether optimizing fuel cell components such as Gas Diffusion Layers (GDL) and Microporous Layers (MPL) or improving reservoir simulations in the oil and gas industry. Why choose the Upscaling Relative Permeability GeoApp? - Maximize Performance: In both, fuel cell technology or oil and gas exploration, improved permeability modeling enhances efficiency, output, and recovery rates. - Work Across Scales: Data from microstructural analysis to larger-scale reservoir modeling are integrated without losing essential details. - Accurate Predictions: Delivers reliable, real-time insights into material and fluid behavior, supporting advanced development and optimized production. - Versatile and Scalable: Suitable for everything from small-scale experiments to large industrial applications, the GeoApp adapts to a wide range of project requirements. Multiscale modeling for better accuracy Overcome limitations in 3D imaging by incorporating both resolved and unresolved data. Capture microstructural details accurately while modeling fluid flow behavior at larger scales. Use upscaling methods that retain important features across different levels, preserving key interactions between microstructures and large-scale performance. Revolutionize projects by accurately modeling fluid dynamics and material behavior across multiple scales. Upscaling relative permeability of combined MPL and GDL (a) Cathode microstructure from generation or captured µCT scan (b) Relative Permeability computation (c) Visualization of fluid flow velocity field within a combined GDL+ MPL microstructure Upscaling relative permeability of heterogeneous rock Input: (a) FIB-SEM scan of a heterogeneous rock (b) Relative permeability of organic matter (c) Relative permeability of illites Result: (d) Upscaled fluid flow field at 50% oil saturation (e) Upscaled relative permeability of Barnett Shale Optimize fuel cells with analysis of combined GDL and MPL Gain deeper insight into the complex interactions between Gas Diffusion Layers (GDL) and Microporous Layers (MPL) and their impact on gas flow and water management in fuel cells. More accurate predictions of fuel cell efficiency, performance, and durability become possible by combining the permeability characteristics of both layers. - Challenge: Achieving the optimal balance between gas flow and water retention in fuel cell components. - Solution: the GeoApp enables simultaneous analysis of GDL and MPL layers, improving gas distribution and water management, leading to enhaced fuel cell efficiency and extended operational lifetime. Enhanced reservoir rock simulations Accurately model complex rock formations such as carbonates by integrating high-resolution and low-resolution data to enhance well productivity and resource extraction. Simulate and predict multiphase fluid flow (oil, gas, and water) through reservoirs to ensure efficient use of each well. - Challenge: Modeling heterogeneous reservoirs and complex carbonates where fine-scale structures and large-scale behavior must be considered together. - Solution: Integrate resolved and unresolved data across scales to build precise reservoir models that predict fluid flow accurately and support maximum resource recovery. Research & Development of digital materials Accurately determine full-scale rel
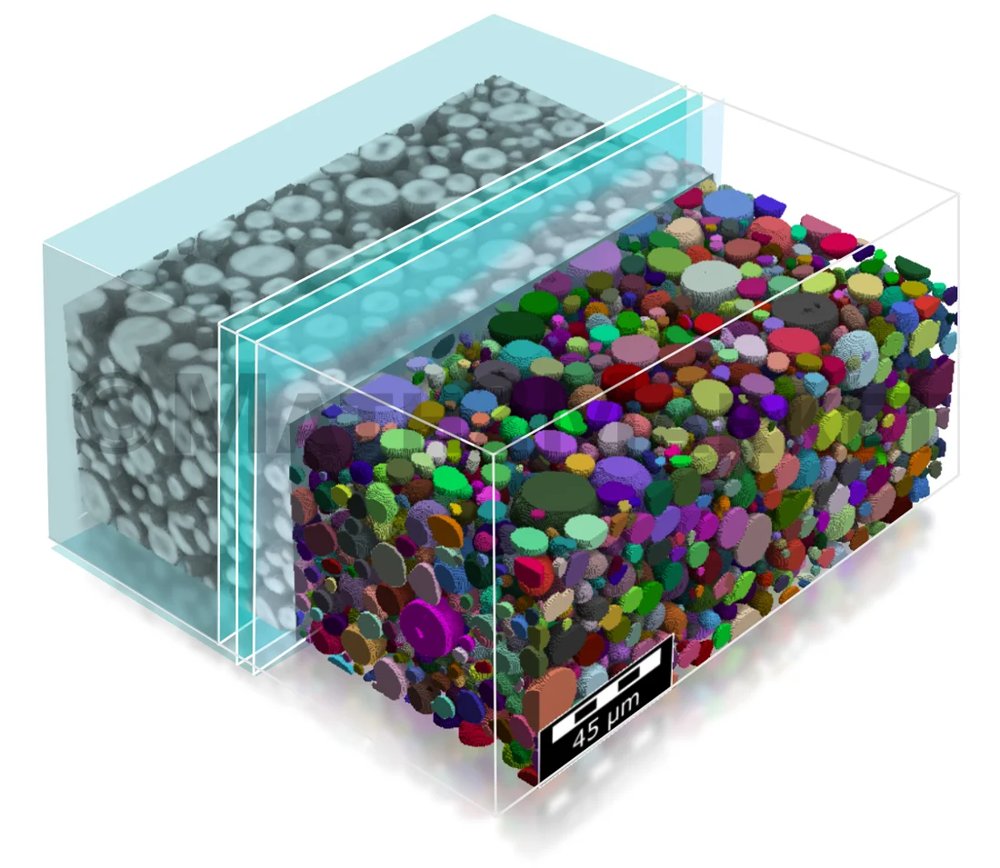
The Grain Find module provides access to statistical information of µCT-scanned granular structures, as e.g., in battery electrodes. The Identify Grains-algorithm computes an individual best-fit shape for each grain in the structure. This way, it recognizes individual grains and its spatial orientation. The acquired information can be loaded into Grain Geo with just one click to generate a representation of the microstructure. This workflow enables to model and vary statistical Digital Twins of the scanned microstructure. In µCT-scans binder and grains often have the same gray values and are thus indistinguishable from each other. For this reason, the "Identify Binder (AI)" identification module was developed. This module uses Artificial Intelligence (AI) to separate grains and binders in the solid phase based on their different shapes. Currently, Geo Dict already includes neural networks to identify the binder in NMC and graphite structures. Other neural networks for very different particle shapes or very different particle size distributions can be trained using the module Geo Dict-AI. The workflow using Grain Find-AI and Grain Geo enables simulations on the structure which would not be possible otherwise. Such as, for example, simulations of mechanical deformations, or electrode charging simulations - both depending on the distribution of the binder and sometimes even on the orientation of the grains of the active material. 3D models of a material are obtained after importing and segmenting µ-CT scans or FIB-SEM scans of this material. Grain Find offers several features to analyze this structure: - Identify and analyze individual grains: grain volume, surface, surface-to-volume ratio, sphericity (shape), orientation, etc. - Compute grain diameter distribution - Identify binder in granular structures using AI Grain identification: The grain identification process uses a specialized watershed algorithm to find individual grains, and subsequently it uses a grain reconnection to reconnect over-segmented grains. Grains on the domain boundary may optionally be removed to prevent a systematic bias in the statistics of the identified grains. Finally, a grain-shape analysis fits ellipsoids, boxes, or short fibers onto the found grains, and hence creates an analytic model for the grains. Statistical data of identified grains: Once the grains are identified as single objects, many possibilities for post processing are available, such as histograms for the diameters, volumes or surfaces of the grains. The diameter distributions, the sphericity and the other calculated parameters can also be visualized in 3D. It is also possible to sort the grains by their diameters, volumes or any other of the calculated parameters. You can even visualize each of the grains individually and for example only consider the largest grains. This allows for instance to assign different stiffnesses to the small grains, as to the intermediate-sized grains, and to the large grains. The calculated grain orientations can later also be considered in conductivity studies or during mechanical simulations. Furthermore, the results of Grain Find be used in Grain Geo to re-built this specific microstructure and make alterations to it. Binder identification (AI): The identification of binder is based on neural networks
CATEGORY
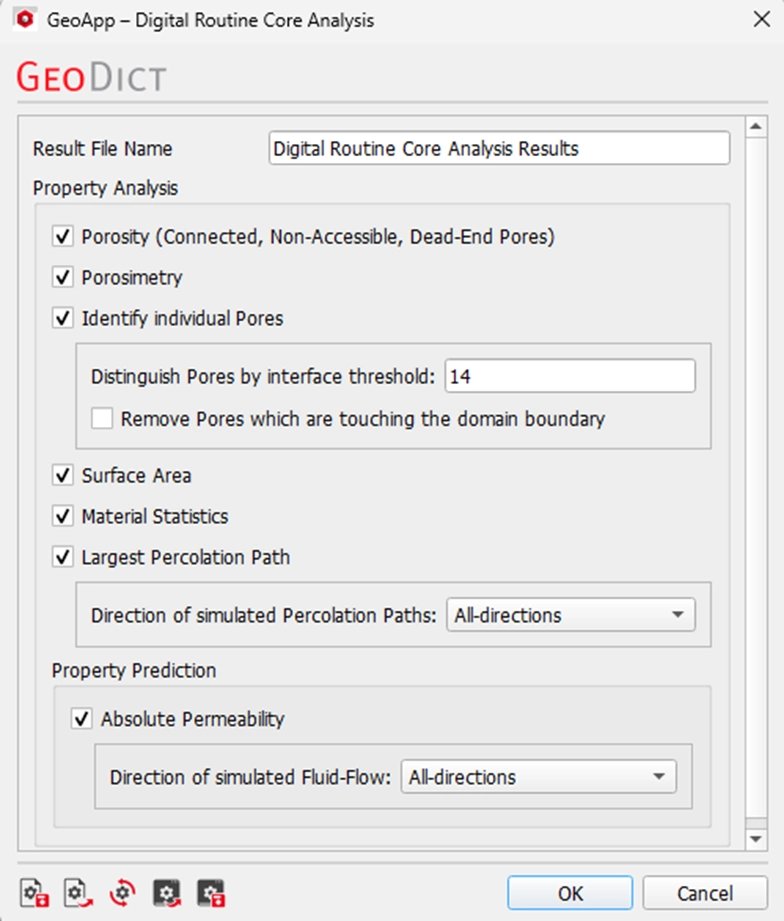
Geo Dict’s Digital Routine Core Analysis (RCA) GeoApp transforms the way you characterize core samples by providing critical insights in a fraction of the time and cost of traditional laboratory methods. It eliminates or significantly reduces destructive core testing and long lab turnaround times! High-quality results that usually take weeks of lab work are now available within hours, making Geo Dict the ideal solution for rapid core plug screening, formation evaluation, and reservoir modeling. Key features: - Automated analysis with just a few clicks: Perform complex core analyses fully automatically, without manual intervention, and with consistent, reproducible results. - Comprehensive material and structure characterization: Calculate all key material properties directly from 3D image data, for a complete understanding of the samples. - Fast and meaningful results: Obtain lab-quality insights in record time: results that would normally take weeks are available within hours. - Reports and visualizations included: Receive ready-to-use PowerPoint reports with clear simulation visualizations for internal reviews, project documentation, or regulatory submissions. - Efficiency and confidence in decision-making: Geo Dict enables confident, data-driven decisions in reservoir management, enhanced oil recovery (EOR), and formation evaluation. In a faster, more accurate, and more flexible way than ever before. Characterize porosity: Analyze the rock structure to distinguish between open and closed pores. Open pores are further classified into dead-end pores and through pores. Analyze pore space statistics: Sort pores according to their volume and gain detailed insights into the pore network. Comprehensive statistics, diagrams, and visualizations provide a clear understanding of the pore space. Predict absolute permeability: Compute permeability tensors and visualize fluid velocity and pressure fields within the rock to better understand flow behavior. Determine the percolation path in one or all directions for a complete assessment of fluid connectivity. Simulation Setup: In the intuitive graphical user interface (GUI), users can easily customize the analysis process to match their specific needs. They can select which properties to compute, define the direction of simulated flow, and even exclude pores that are in contact with the boundaries for greater flexibility and control. 1. Compute porosity to obtain detailed information about open, dead-end, through, and closed pores. 2. Utilize digital porosimetry to determine the pore throat size distribution. 3. Identify individual pores and adjust the interface threshold. If needed, exclude pores that touch the boundaries. The analysis also calculates pore volume, diameter statistics, orientation, and the number of pores and their contacts. 4. Choose whether to estimate the surface area by counting voxel surfaces and calculating the corresponding real surface area. 5. Compute material statistics to perform detailed layer analyses. 6. Determine the percolation path in any chosen direction by simulating fluid flow through the rock and visualizing its main passage. 7. Compute absolute permeability in selected directions and visualize the resulting pressure and velocity fields. A license is required for the following modules: Poro Dict, Mat Dict, Flow Dict
CATEGORY
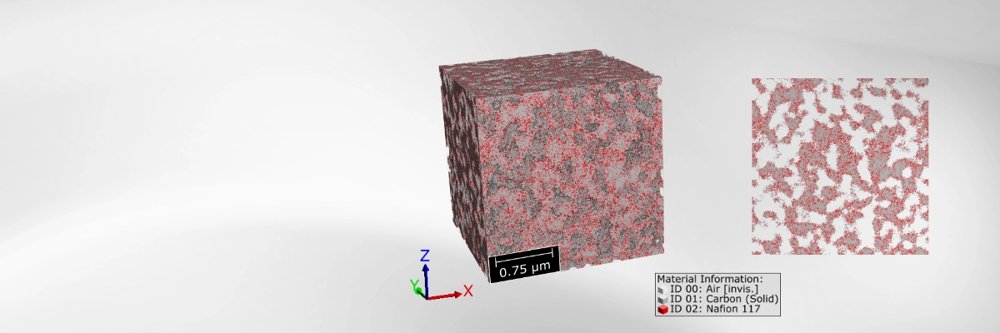
Catalyst Layers play a significant role for the performance of Proton Exchange Membrane (PEM) Fuel Cells. Their microstructure influences the electrochemical reactions as well as transport processes in the fuel cell. Due to the complex morphology of the microstructure, with nanoscale resolution, creating image data is very challenging, time intensive and expensive. Digital generation of microstructures helps to overcome this challenge. The GeoApp Catalyst Layer PEM Fuel Cell Generation offers two different approaches to generate realistic catalyst layer microstructures, consisting of carbon, ionomer and pore space. One is a parametric approach, the other one uses advanced stochastic geometric modeling. Based on user-inputs- such as voxel resolution, layer dimensions, particle content, and ionomer fraction – the GeoApp generates realistic 3D catalyst layer geometries that capture the complex morphology. The parametric approach enables the systematic creation and analysis of catalyst layer microstructures with particle packing methods, offering full control over their defining parameters. With the advanced stochastic geometric modeling approach, the GeoApp generates realistic catalyst layer microstructures from Gaussian random fields. This approach offers an advanced alternative to particle packing methods. It allows additionally to control the wetting behavior of the materials and to use different correlation functions for generating the Gaussian random fields. The predefined parameters for the random fields and the thresholding are customized for catalyst layers of PEM fuel cells. The outcome, with both approaches, are physically meaningful, fully customizable 3D structures ready for virtual testing, image analysis and multi-physics simulations to virtually evaluate the influence of microstructure variation on effective transport properties, including diffusivity, electrical conductivity and ionic conductivity. This allows targeted optimization towards one or multiple performance-relevant effective parameters. Beyond microstructural analysis, the generated ensemble of catalyst layer structures serves as a robust basis for multiscale upscaling. The computed effective properties can be transferred to larger-scale models - from 1D and 2D representations up to full 3D simulations - enabling predictive assessment of fuel cell component and stack-level performance. In this way, the application bridges the gap between microstructure design and system-level optimization, supporting data-driven development of high-performance catalyst layers. The advanced stochastic geometric modelling approach is not restricted to catalyst layers of PEM fuel cells. Similar approaches, customized for other structure types, are available in the Geo Apps Solide Oxide Electrode Generation and Solid State Battery Cathode Generation. Use cloud-based simulations to accelerate catalyst layer innovation: With Geo Dict Cloud and Massive Simultaneous Cloud Computing (MSCC), hundreds of virtual structures can be analyzed in parallel, drastically reducing time-to-insight. Catalyst Layer PEM Fuel Cell Generation with stochastic approach Example: Catalyst Layer of a PEM fuel cell with volume percentages: - Carbon particles: 50 % - Ionomer: 10 % - Pore space: 40%
CATEGORY
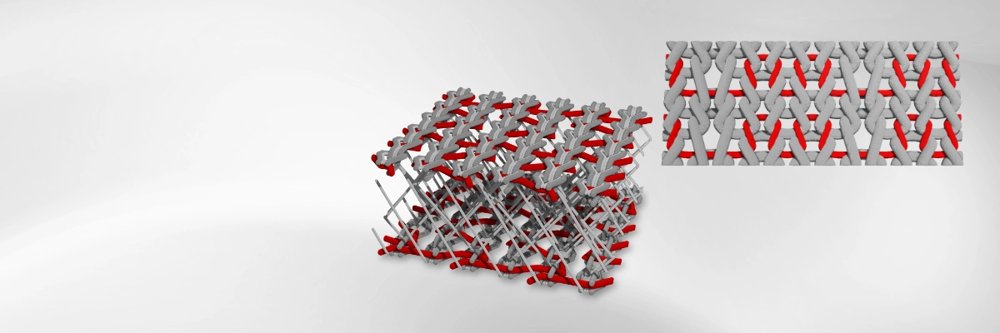
Digital Modeling of weft- and warp-knitted Textiles In addition to woven textiles, weft- and warp-knitted fabrics are used in a wide range of specialized applications, including filtration, thermal insulation, and noise reduction in the automotive, process, and energy industries. Their complex mesh structures offers a high degree of design freedom, particularly through the extension of flat textiles into three-dimensional forms such as spacer fabrics. Virtual textile design and simulation-based testing enable an efficient and resource-saving development process. As a result, the prototyping of technical weft- and warp-knitted fabrics becomes faster and more sustainable. GeoApp Features Virtual microstructure generation The TexMath GeoApp enables the generation of realistic microstructures for weft- and warp-knitted fabrics with desired dimensions and specifications. When combined with modules such as Filter Dict, Conducto Dict, or Acousto Dict, it allows the efficient calculation of the textile's filtration, insulation, and sound absorption properties, as well as targeted design optimization for specific applications, without the need for physical experiments. In addition to the fabric pattern, a range of parameters can be defined for each textile type: - Yarn diameters - Count of rows per unit length - Count of needles per unit length - Layer spacing: for multilayered textiles (e.g. spacer fabrics), the distance between individual textile layers can be defined The resulting periodic structures can be generated with any number of repetitions and at a user-defined resolution. The TexMath GeoApp allows users to easily generate a wide range of weft- and warp-knitted textile microstructures by adjusting geometric parameters. The resulting geometries range from established flat knitted fabrics to innovative three-dimensional spacer fabrics. This flexibility enables comprehensive, application-specific analysis and optimization of the microstructure of knitted textiles. Outlook: Simulation of large deformations considering yarn-yarn contacts Deformations in knitted structures are highly nonlinear. This behavior arises from the nonlinear force-strain response of the yarns and from substantial structural reorientation caused by the free sliding of yarns at contact points. The mechanical solvers in TexMath support tensile, shear, and bending simulations of the generated knitted textile microstructures. A key feature of the underlying numerical methods is the explicit representation of sliding yarn-yarn contacts, combined with efficiency gains achieved through dimensional reduction techniques. This approach enables not only the simulation of textile mechanical behavior but also couplied analyses, such as fluid flow simulations in deformed configurations. Mechanical simulations are already available in the external TexMath software and are planned for integration into future versions of the GeoApp. The following GeoDict modules are often used in combination with the TexMath GeoApp: Import & Image Processing Image Analysis Material Modeling Simulation
CATEGORY
