Our semiconducting and conducting inks are also tested for logic, photovoltaics, anti-counterfeiting and biomarkers, among other applications.

These single-wall carbon nanotubes are purified to values of 95-98% (nanotube content measured via the Itkis ratio). PureTubes offer metal content lower than 5% and SuperPureTubes offer less than 2% metal content (as per TGA). These are our highest purity un-sorted nanotubes. Sourced from the arc-discharge processes and offered in solution or dry powder. Properties at a Glance Nanotube Type: Arc discharge (Manufacturer data) Diameter Range: 1.2 – 1.7 nm (Manufacturer data) Mean Diameter: 1.4 nm (Manufacturer data) Length Range: 100 nm – 4 μm (AFM) Mean Length: ~1 micron (AFM) Catalyst Impurity: ~0.5% by mass (NAA, TGA) Carbonaceous Impurity: < 5% by mass (TGA, Raman) Semiconducting CNT Content: n/a (Optical absorbance) Metallic CNT Content: n/a (Optical absorbance) Shelf Life: 6 months Nanotube Concentration: 0.25 mg/mL (solution) Surfactant Concentration: 1% w/v (solution) Surfactant Type: Ionic (proprietary mixture) (solution) Optical Absorbance: Figure 1. Optical absorbance plots for our PureTubes. Following the method of Ouyang et al. (Acc. Chem. Res. 35, 1018 (2002)), we can calculate the transition energies for nanotubes in our diameter range (1.2 – 1.7 nm). We see peaks where we would expect them: S33 transitions should lie between ~450-630 nm, M11 transitions between ~600-850 nm, and S22 transitions between ~ 900-1,270 nm. We estimate our SWCNT purity by the ratio of the S22 peak area (after linear background subtraction) to the total area in the band (Itkis et al. JACS (2005) 127, pp 3439-3448). Before comparison, the individual peak areas are scaled by empirically determined values for the M11 and S22 extinction coefficients. Metal Catalyst – Neutron Activation Analysis: Unprocessed SWNTs / PureTubes - Nickel (wt %) 3.59 / 0.23; Yttrium (wt %) 0.70 / 0.05; Iron (wt %) 0.70 / 0.06; Total (wt %) 4.99 / 0.34; Iodine (wt %) 0.00 / 0.00. Full elemental profiles of our products are available upon request. Figure 2. Neutron activation analysis (NAA) data taken from our unprocessed and PureTube powders. NAA reveals that our PureTubes contain significantly lower levels of metallic/catalyst impurities than the raw arc discharge SWNTs from which they are produced. Metal Catalyst – Thermogravimetric Analysis: Figure 3. Thermogravimetric (TGA) plots of our nanotube products. Because our PureTubes do not contain iodixanol, the burnoff of residual surfactant and amorphous carbon is solely accountable for the ~5% mass decrease which occurs between approximately 200 and 400°C. Amorphous Carbon – Raman: Figure 4. Resonance Raman plots for our PureTubes. All Raman measurements were taken using a 514 nm laser. The G/D ratios of our products range from approximately 12 to 41, indicating extremely low levels of amorphous carbon and/or damaged nanotubes. Length – Atomic Force Microscopy: Figure 5. Atomic-force microscopy (AFM) data indicates that our SWNTs range in length from approximately 100 nm to 4 microns. Length histograms of our PureTubes. Large volume discounts available for large quantities.
CATEGORY

Metallic single-wall carbon nanotubes are a NanoIntegris exclusivity. Sorted using our patent density gradient ultracentrifugation (DGU) process. Offered in an acqueous solution or a powder. Properties at a Glance: Nanotube Type: Arc discharge (Manufacturer data) Diameter Range: 1.2 – 1.7 nm (Manufacturer data) Mean Diameter: 1.4 nm (Manufacturer data) Length Range: 100 nm – 4 μm (AFM) Mean Length: ~0.5 micron (AFM) Catalyst Impurity: ~1% by mass (NAA, TGA) Carbonaceous Impurity: < 5% by mass (TGA, Raman) Semiconducting CNT Content: n/a (Optical absorbance) Metallic CNT Content: 70%, 95%, 98% or 99% (Optical absorbance) Shelf Life: 6 months (Solution) Nanotube Concentration: 0.01 mg/mL (Solution) Surfactant Concentration: 1% w/v (Solution) Surfactant Type: Ionic (proprietary mixture) (Solution) Electronic Type Enrichment (Optical Absorbance): Figure 1. Optical absorbance plots for our IsoNanotubes-M (98%). IsoNanotubes-S (99%), and PureTubes, respectively. Following the method of Ouyang et al. (Acc. Chem. Res. 35, 1018 (2002)), we can calculate the transition energies for nanotubes in our diameter range (1.2 – 1.7 nm). We see peaks where we would expect them: S33 transitions should lie between ~450-630 nm, M11 transitions between ~600-850 nm, and S22 transitions between ~ 900-1,270 nm. We estimate our metallic and semiconducting enrichment levels based on ratios of the M11 and S22 peak areas after linear background subtraction. Before comparison, the individual peak areas are scaled by empirically determined values for the M11 and S22 extinction coefficients. Metal Catalyst (Neutron Activation Analysis): Figure 2. Neutron activation analysis (NAA) data taken from our IsoNanotube and PureTube powders. NAA reveals that our IsoNanotubes and PureTubes contain significantly lower levels of metallic/catalyst impurities than the raw arc discharge SWNTs from which they are produced. Our IsoNanotube samples, however, contain approximately 5% iodine by mass, resulting from residual iodixanol on the surface of the nanotubes that is not eliminated by our surfactant removal procedures. Full elemental profiles of our products are available upon request. Metal Catalyst (Thermogravimetric Analysis): Figure 3. Thermogravimetric (TGA) plots of our nanotube products. Approximately 2/3 of the ~15% mass decrease which occurs between ~200 and ~400°C is attributable to the burnoff of residual iodixanol adsorbed to the surface of the nanotubes. NAA data indicates that our IsoNanotubes contain roughly 5% iodine by mass (see Figure 3); iodine comprises roughly half the mass of an iodixanol molecule. The remaining 5% mass decrease is attributable to the burnoff of residual surfactant and carbonaceous impurities. Amorphous Carbon (Raman): Figure 4. Resonance Raman plots for our IsoNanotubes-M (95%). IsoNanotubes-S (99%), and PureTubes, respectively. All Raman measurements were taken using a 514 nm laser. The G/D ratios of our products range from approximately 12 to 41, indicating extremely low levels of amorphous carbon and/or damaged nanotubes. Length (Atomic Force Microscopy): Figure 5. Atomic-force microscopy (AFM) data indicates that our SWNTs range in length from approximately 100 nm to 4 microns. Length histograms of our IsoNanotubes-M respectively. Large volume discounts available for large quantities. Please contact us for more information.
CATEGORY
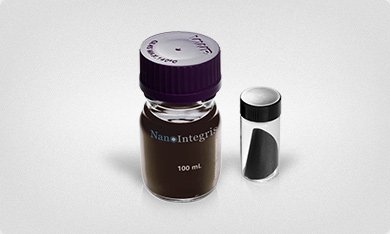
PureSheets are graphene nanoplatelets from the liquid exfoliation of graphite. PureSheets-MONO GNP contain, on average, 1-3 graphe...
CATEGORY

These single-wall carbon nanotubes are purified to values of 95-98% (nanotube content measured via the Itkis ratio). PureTubes offer metal content lower than 5% metal content (as per TGA). These are our highest purity un-sorted nanotubes. Sourced from the arc-discharge processes and offered in solution or dry powder. Characterisation Optical Absorbance Figure 1. Optical absorbance plots for our PureTubes. Following the method of Ouyang et al. (Acc. Chem. Res. 35, 1018 (2002)), we can calculate the transition energies for nanotubes in our diameter range (1.2 – 1.7 nm). We see peaks where we would expect them: S33 transitions should lie between ~450-630 nm, M11 transitions between ~600-850 nm, and S22 transitions between ~ 900-1,270 nm. We estimate our SWCNT purity by the ratio of the S22 peak area (after linear background subtraction) to the total area in the band (Itkis et al. JACS (2005) 127, pp 3439-3448). Before comparison, the individual peak areas are scaled by empirically determined values for the M11 and S22 extinction coefficients. Metal Catalyst Neutron Activation Analysis Nickel (wt %): Unprocessed SWNTs 3.59, PureTubes 0.23 Yttrium (wt %): Unprocessed SWNTs 0.70, PureTubes 0.05 Iron (wt %): Unprocessed SWNTs 0.70, PureTubes 0.06 Total (wt %): Unprocessed SWNTs 4.99, PureTubes 0.34 Iodine (wt %): Unprocessed SWNTs 0.00, PureTubes 0.00 Full elemental profiles of our products are available upon request. Figure 2. Neutron activation analysis (NAA) data taken from our unprocessed and PureTube powders. NAA reveals that our PureTubes contain significantly lower levels of metallic/catalyst impurities than the raw arc discharge SWNTs from which they are produced. Metal Catalyst Thermogravimetric Analysis Figure 3. Thermogravimetric (TGA) plots of our nanotube products. Because our PureTubes do not contain iodixanol, the burnoff of residual surfactant and amorphous carbon is solely accountable for the ~5% mass decrease which occurs between approximately 200 and 400°C. Amorphous Carbon Raman Figure 4. Resonance Raman plots for our PureTubes. All Raman measurements were taken using a 514 nm laser. The G/D ratios of our products range from approximately 12 to 41, indicating extremely low levels of amorphous carbon and/or damaged nanotubes. Length Atomic Force Microscopy Figure 5. Atomic-force microscopy (AFM) data indicates that our SWNTs range in length from approximately 100 nm to 4 microns. Length histograms of our PureTubes. Properties at a Glance Nanotube Type: Arc discharge (Manufacturer data) Diameter Range: 1.2 – 1.7 nm (Manufacturer data) Mean Diameter: 1.4 nm (Manufacturer data) Length Range: 100 nm – 4 μm (AFM) Mean Length: ~1 micron (AFM) Catalyst Impurity: ~0.5% by mass (NAA, TGA) Carbonaceous Impurity: < 5% by mass (TGA, Raman) Semiconducting CNT Content: n/a (Optical absorbance) Metallic CNT Content: n/a (Optical absorbance) Shelf Life: 6 months Nanotube Concentration: 0.25 mg/mL Surfactant Concentration: 1% w/v Surfactant Type: Ionic (proprietary mixture)
CATEGORY
