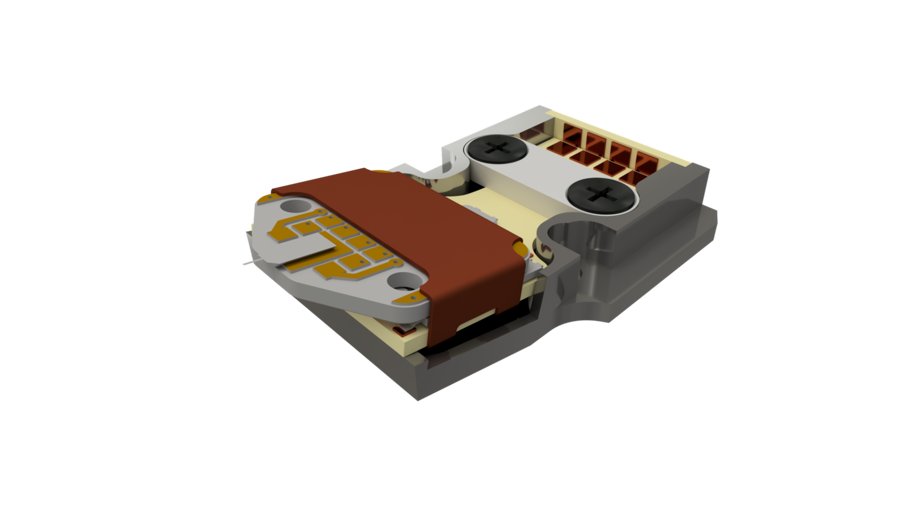
By NenoVision
F-z spectroscopy is a valuable tool for precise local sample characterization. Spectroscopy is used for many purposes such as sample stiffness analysis, detailed surface-tip force progress or local elasticity/plasticity determination.
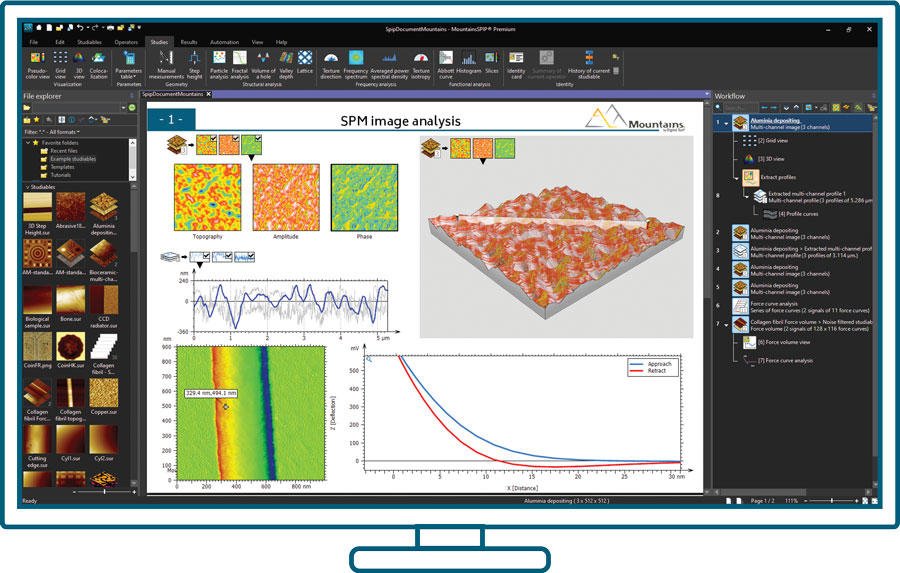
Key features of MountainsSPIP® software: - Interactive particle analysis: detect, quantify, and classify structures of any shape and size. - Force curve and force volume image analysis: analyze force curves and force volume images with precision and ease. - Correlative analysis: seamlessly combine your AFM data with data from your SEM. - Multi-channel file analysis: easily handle and analyze multi-channel files, simplifying complex data processing. - Data enhancement: correct, normalize, and denoise your measured data to extract meaningful insights. - Accurate XY calibration: ensure precise XY calibration for precise measurements and analysis. - Tip effect correction: correct for tip effects to enhance the accuracy of your results. - Surface texture characterization: investigate surface texture in compliance with ISO standards.
CATEGORY
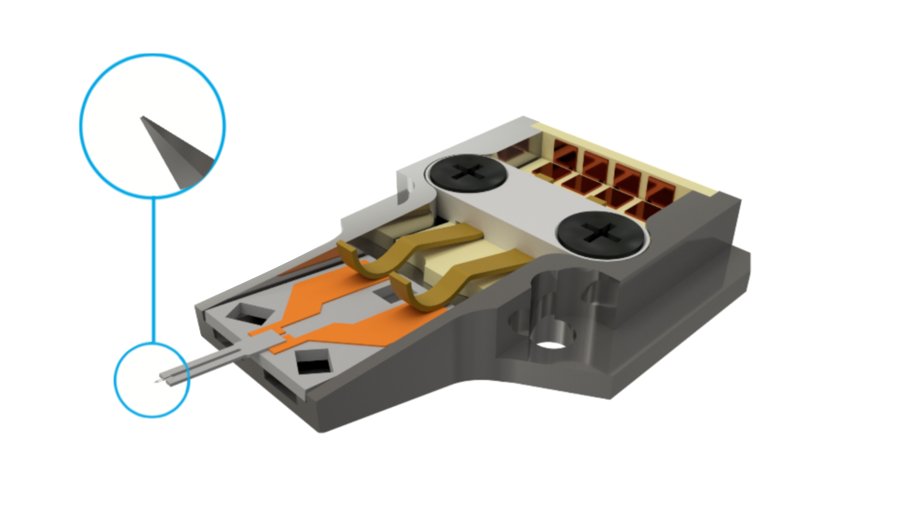
The go-to probe for CPEM measurements thanks to its visible tip. Capable of measuring AFM topography and energy dissipation signal at the same time. Measurement modes: Topography, Energy dissipation
CATEGORY
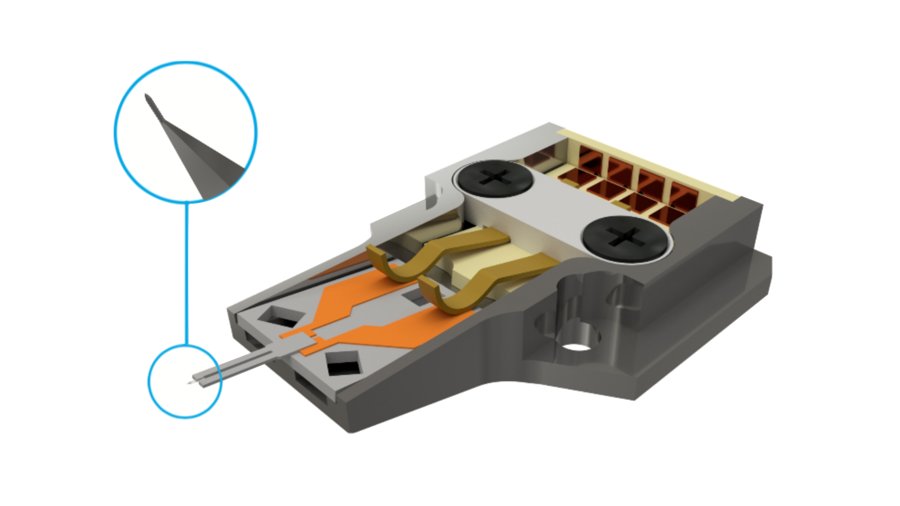
Magnetic-sensitive probe based on the Akiyama sensor, that can be used in SEM thanks to its visible tip. It uses the same probe holder as regular Akiyama. Measurement modes: Topography, MFM
CATEGORY