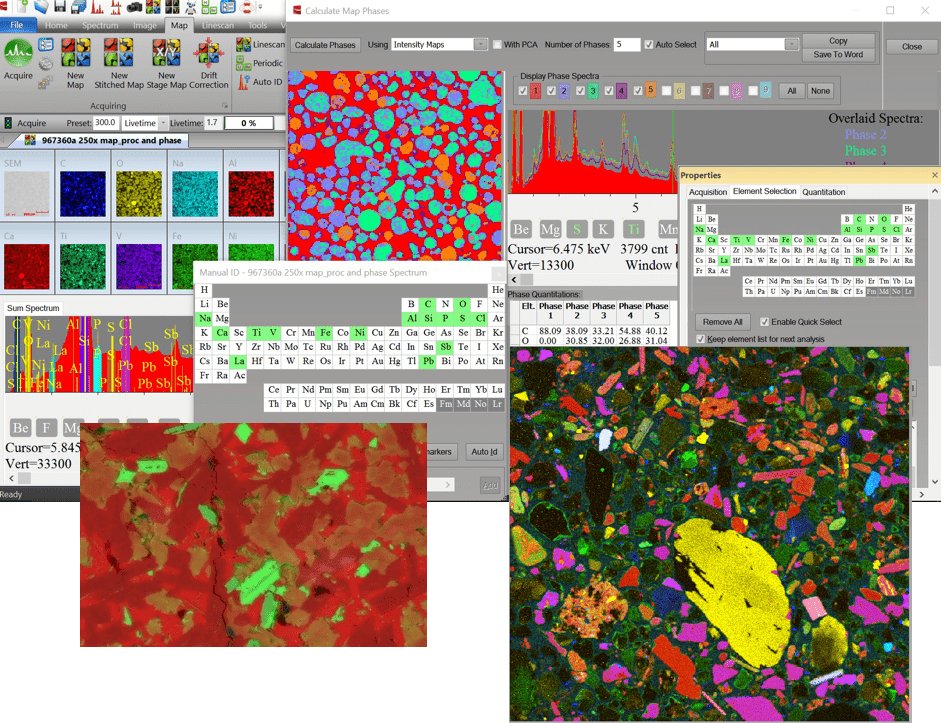
Advanced EDS/XRF Elemental Analysis & Imaging Software For our SEM-EDS, SEM-XRF and microEDXRF products, IXRF offers Iridium Ultra: an all-inclusive state-of-the-art software suite featuring a myriad of comprehensive qualitative and quantitative capabilities supporting both e-beam and X-ray excitation. Included are stage control and automation, data acquisition, spectral manipulation (including deconvolution and artifact removal), mapping, imaging, and statistical analysis tools. The platform is unsurpassed in it's ability to provide elemental and phase mapping, line scans, critical dimensions (CD) as well as qualitative and quantitative elemental analyses. For the ATLAS microXRF line, this includes analysis of solids, liquids, particles, powders and thin films. Spectra Overview - Identifying Elements - Spectrum Processing - Annotations - Spectrum Overlay - Spectrum Reporting Identify Elements Kα Energy Markers help easily identify elemental peaks Identify elements through cursor ID by selecting individual energy channels. Spectrum Processing - Peak separation using Gaussian deconvolution - Automatic peak-overlap correction - Automatic escape and sum peak removal - Automatic Standardless Quantification using ZAF Annotation Selecting Annotations from the Spectrum toolbar opens a new window that allows the user to measure, label, add text, etc. on the spectrum. These annotations are fully customizable and can be exported with the spectrum. Spectrum Overlay Spectra can be overlaid to easily compare the relative compositions in samples Spectrum Reporting Create a simple spreadsheet report of multiple spectra's quantitative analysis. IMAGING OVERVIEW - Image Acquisition - Analysis Suite (Toolbar) - Morphology - Segmentation - Stitching/Montage - Automated Particle & Multi-point Analysi IMAGE DIRECT ACQUIRE The Direct Acquire tools allow for EDS data to be collected by selecting the region of interest from the SEM image. This includes spot/rectangle/free hand spectra as well as maps and linescans on the image. MULTIPART ACQUIRE Multipart Acquire allows fully automated spectrum analysis with customized EDS settings and automatically generated spectrum analysis reports. This includes single point, raster area, and freehand line spectrum acquisition. SEGMENTATION Image Segmentation provides a visual representation of different phases in an image. Based upon histogram analysis, you can see the percent area each phase occupies. MORPHOLOGY Image Morphology provides particle information through image binarization. Image binarization transforms the image into grayscale based upon histogram data. This allows you to label and measure pixels to provide an abundance of morphological data. LINESCANS OVERVIEW - Multielement Linescan Acquisition - Linescan Overlay - DataView (Intensity/Concentration) - MultiScan MAPPING OVERVIEW - Mutielement Quantitative Mapping - Overlay Maps - Map Analysis Suite (Toolbar) - Extract Spectra (Freehand, Spot, Area) - Extract Linescan - DataView (Intensity/Concentration) - Beam Drift Correction - Maximum Pixel Spectrum - Map stitch & montage - Automate Stage and Beam automation - Composition Mapping - Phase Analysis MAPPING ANNOTATIONS Selecting Annotations from the Map toolbar opens a new window that allows the user to measure, label, add text, etc. on the map. SPECTRA FROM MAP Combine X-Ray Map pixels to extract spectra from a region of interest ELEMENTAL INTENSITIES Selecting Element Intensities from the Map tab will open a new window. A spot/rectangle/freehand can be placed on the image to compare the intensity/concentration. PHASE MAPS Selecting Phase Maps from the Map tab will identify different phases within a sample and quantitatively analyze the elements within each phase. The different phases will be graphically displayed in a map alongside phase-specific overlaid spectra to provide a qualitative comparison. RATIO MAPS Analyze the element ratios in a region of interest and displays a comparison of element weight percent ratios. COMPOSITION MAPPING Selecting Composition Mapping from the Map tab will identify map locations containing specific element concentrations according to specified parameters. Quantitative analysis is performed on every pixel where a calculated concentration is compared to a specified concentration. Matching pixels are then displayed in the composition map. QUANTITATIVE ELEMENT/COMPONENT MAPS Quantitative Maps convert the displayed pixel data to Concentration (wt%) from Intensity (cps). This feature can display the quantitative maps as either elemental maps or components maps (ie; oxides). Thermal / Heat Maps Image Analysis Peak fitting & Deconvolution Line Scan From a Map Morphology From a Map Elemental Map Overlays Morphology Least Squares Calibration Automatic Phase ID on Maps Reporting within Software
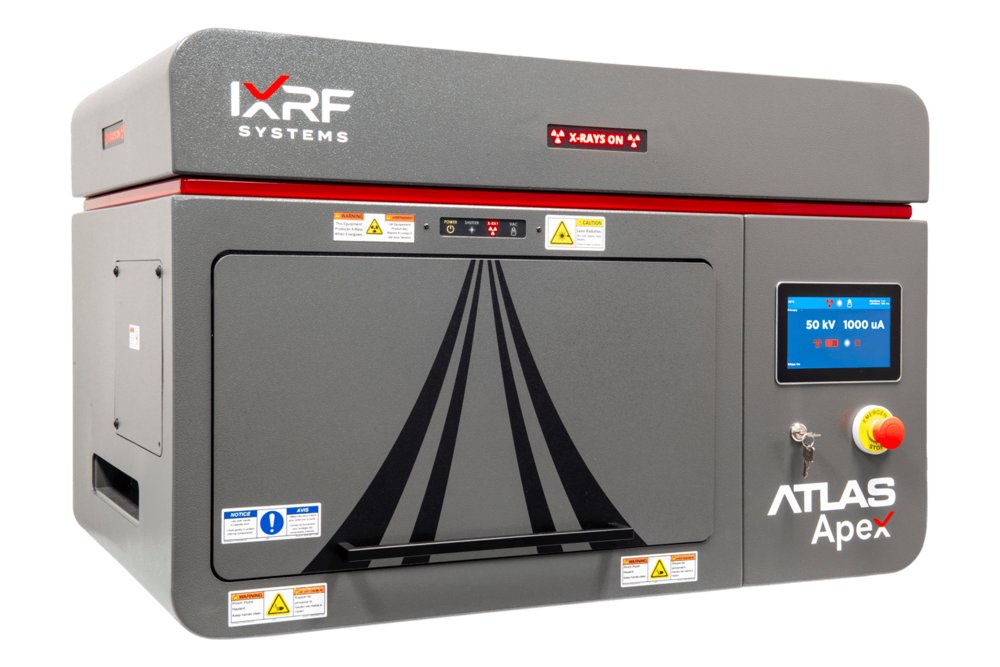
High-resolution microXRF elemental mapping, hyperspectral XRF imaging, and quantitative micro-scale analysis for research and industrial laboratories What is the Atlas Apex M? The Atlas Apex M is a benchtop microXRF spectrometer designed for non-destructive elemental mapping, hyperspectral XRF imaging, and quantitative micro-scale analysis. It combines a microfocus X-ray source and polycapillary focusing optics with perpendicular excitation geometry, up to four SDD detectors, automated XYZ positioning, and Iridium Ultra software. Configurations provide X-ray spot sizes down to 5 µm for analyzing solids, powders, particles, liquids, thin films, coatings, geological materials, electronics, and other complex samples. 5 µm High-Resolution Elemental Mapping Atlas Apex M is a benchtop microXRF spectrometer designed for high-resolution elemental mapping, hyperspectral XRF imaging, and quantitative micro-scale analysis. Its 5 µm X-ray spot enables detailed chemical imaging, allowing users to resolve fine features, identify localized elemental variations, and characterize complex materials with exceptional spatial accuracy. This high-resolution capability is especially valuable for applications such as geological thin sections, mineral mapping, contamination analysis, coatings, semiconductors, and advanced materials research, where smaller beam sizes reveal finer elemental distributions, sharper phase boundaries, and subtle sample heterogeneity that larger spot sizes may miss. When it comes to XRF microscopic imaging (mapping), smaller is always better. Above is a geologic thin section comparing (left to right) a 5µm beam with a 10µm and 20µm beam respectively. Perpendicular Geometry for an “On Target” Circular X-ray Spot Atlas Apex M uses perpendicular microXRF geometry, with the X-ray beam directed normal to the sample surface. This geometry produces a circular excitation spot rather than an elongated elliptical footprint, helping preserve spatial accuracy during hyperspectral XRF mapping. The result is cleaner image fidelity, improved feature definition, and more reliable elemental distribution data across the sample surface. Up to Four SDD Detectors for Faster Mapping Atlas Apex M can be configured with up to four Silicon Drift Detectors, providing a large solid angle for efficient X-ray collection. This multi-detector architecture supports high count rates, improved throughput, and fast high-resolution mapping while maintaining excellent spectral performance. For laboratories that need to analyze large areas, compare many regions of interest, or process multiple sample types, this detector flexibility helps balance resolution, sensitivity, and speed. Large-Area Automated Sample Mapping Atlas Apex M includes mosaic automation that stitches high-magnification overview camera images into a single large-area composite. This gives users a clear visual reference of the sample beyond the native camera field of view and makes it easier to define regions of interest for automated spot analysis, elemental mapping, and linescans. Integrated with Atlas Automation, mosaic imaging streamlines sample setup, navigation, and ROI selection. Automated Spot, Mapping, and Linescans Atlas Apex M supports automated microXRF workflows for spot analysis, elemental mapping, and linescans. Users can define points, regions, or paths across a sample and collect spatially resolved XRF data with minimal manual intervention. These automated workflows improve productivity, repeatability, and confidence when analyzing complex or heterogeneous materials. Iridium Ultra Software for MicroXRF Analysis Atlas Apex M is powered by Iridium Ultra, IXRF’s in-house software platform for acquisition, automation, mapping, quantification, phase analysis, and reporting. The software is designed to be accessible for new users while providing advanced tools for experienced analysts, including custom report generation, microXRF phase analysis, particle analysis, morphology tools, quantitative mapping, and ASTM testing methods. Flexible Sample Types and Analysis Conditions Atlas Apex M is designed to analyze a wide range of sample types and conditions. The system supports solids, liquids, powders, particles, thin films, coatings, and irregular samples, with operation in air, vacuum, or helium atmosphere. Its large vacuum chamber improves light-element sensitivity and allows the system to be ready for vacuum analysis in under one minute. Designed and Manufactured the USA Atlas Apex M is designed, manufactured, and supported by IXRF Systems in Austin, Texas. The instrument hardware, software, and application support are developed in-house, giving laboratories direct access to the expertise behind the system. 50 W Microfocus X-ray Source with Polycapillary Focusing Optics Atlas Apex M uses a 50 kV / 50 W Rh-target X-ray tube, with other target materials available depending on application requirements. The excitation system is paired with polycapillary focusing optics to deliver small, high-intensity primary X-ray spots for micro-scale elemental analysis. Available primary X-ray spot sizes include 5, 10, 15, 20, 25, 40, and 100 µm, allowing users to balance spatial resolution, sensitivity, and throughput based on the sample and analytical goal. A filter wheel with up to seven filters plus an open position is positioned before the focusing optic, providing flexible beam conditioning for optimized excitation across different elements and materials. Silicon Drift Detector Configuration Atlas Apex M can be configured with up to four (4) Silicon Drift Detectors for increased X-ray collection efficiency, improved precision, and reduced acquisition times. This flexible detector architecture allows laboratories to match detector area and configuration to their analytical priorities, whether the goal is trace element sensitivity, fast mapping, high spectral quality, or high-throughput sample analysis. Detector options range from 30 mm² to 65 mm² and are arranged in close-coupled geometry to maximize solid angle collection efficiency. Each detector is Peltier thermoelectrically cooled and supports excellent spectral performance, with energy resolution down to ≤125 eV depending on detector configuration and operating conditions. Chamber and Perpendicular Geometry The Atlas Apex M chamber is designed to support a wide range of sample types and sizes while maintaining the geometry needed for accurate microXRF imaging. The chamber measures 508 × 457 × 254 mm, or 20 × 18 × 10 inches, and provides a large automated mapping area of 220 × 200 mm. Atlas Apex M uses top-down perpendicular geometry, with the X-ray beam directed normal to the sample surface. This geometry helps maintain a circular excitation spot and supports accurate hyperspectral XRF imaging by reducing the spatial distortion associated with angled excitation geometries. Three sample positioning and analysis cameras assist with navigation, region-of-interest selection, and sample alignment. Samples may also be positioned manually with the chamber door open, giving users additional flexibility during setup. Automated XYZ Sample Stage Atlas Apex M includes motorized X, Y, and Z stages for automated spot analysis, linescans, and elemental mapping. The high-speed stage system supports movement speeds up to 300 mm/s, map acquisitions at ≤1 ms per pixel, and positioning accuracy below 1 µm. This precision motion platform enables repeatable analysis of small features, large-area maps, multiple regions of interest, and complex sample layouts. Custom sample adapters are also available to support specialized workflows, unusual sample geometries, and application-specific mounting requirements. Atlas Apex M features Atlas Apex M delivers high-performance microXRF analysis in a compact benchtop platform. Designed for high-resolution elemental mapping, hyperspectral XRF imaging, and quantitative micro-scale analysis, it combines a 50 kV / 50 W polycapillary X-ray source, spot sizes down to 5 µm, configurable SDD detectors, and a large sample chamber for flexible laboratory workflows. Key features include: - Benchtop / tabletop microXRF spectrometer design - X-ray spot size down to 5 µm with anti-halo optic - SDD detector configurations with active areas up to 65 mm² - Large chamber volume for diverse sample types - Multi-point, multi-area, mapping, and linescan automation - Air, vacuum, or helium operation for solids, liquids, powders, particles, thin films, and coatings - Iridium Ultra software running on Windows® 11 for acquisition, mapping, quantification, phase analysis, and reporting Specifications Elemental range: Fluorine (F) through Americium (Am). Carbon (C) through Americium (Am) on the LE version of Atlas Sample types: Solids, liquids, particles, powders and thin films Sample chamber size: 508 x 457 x 254 mm (20 x 18 x 10 inches)
CATEGORY
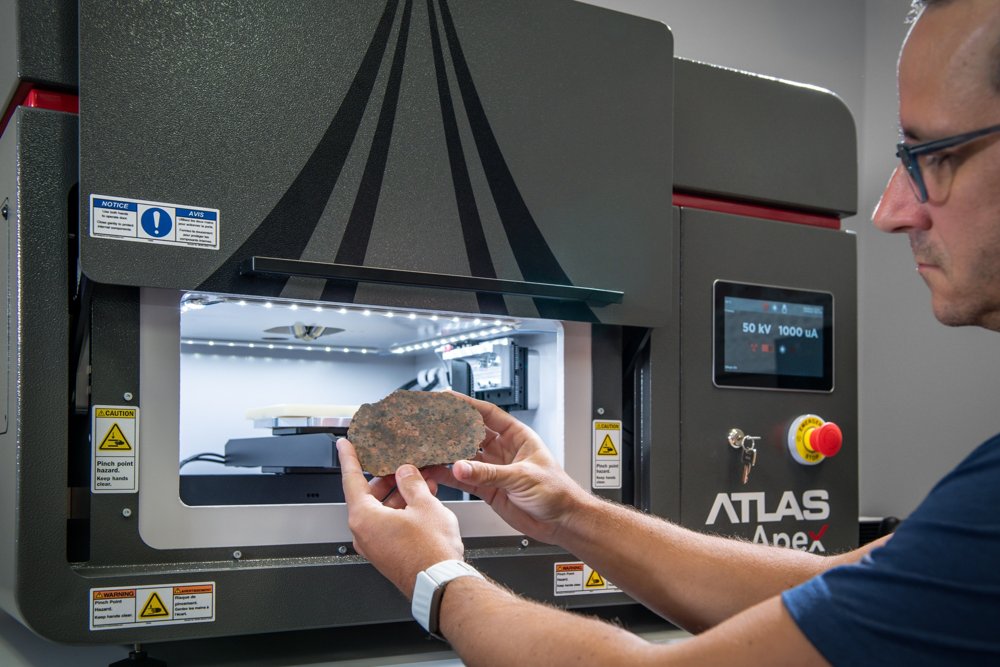
IXRF Systems Atlas Apex microXRF delivers high-resolution, non-destructive elemental mapping for geology, critical minerals, mining, and industrial materials applications. With ≤10 µm spatial resolution, enhanced light-element sensitivity, and high-throughput multi-SDD detection, Atlas Apex connects bulk chemistry, mineralogy, and material performance—supporting USGS critical mineral programs, industrial processing optimization, and quality control without damaging valuable samples. What Can Atlas Apex microXRF Measure in Geological Samples? Built for Complex, Heterogeneous Materials. Geological and industrial samples are rarely uniform. Atlas Apex microXRF is engineered to handle multi-phase, high-density, and chemically complex materials while maintaining quantitative accuracy and mapping efficiency. Core Capabilities: - ≤10 µm circular excitation spot for distortion-free mineral and phase mapping - Multi-SDD detector architecture (up to 4) for enhanced trace-element sensitivity - Large sample chamber supporting thin sections, polished mounts, drill chips, hand samples, slabs, and cores - Non-destructive analysis preserving irreplaceable or process-critical materials - High-speed mapping for large-area surveys, linescans, and industrial throughput Can microXRF Identify and Quantify Mineral Phases? - Light-element performance under vacuum (C, O, Na, Mg, Al, Si) - Mineral and phase recognition tools using reference databases - QUANTMAP pixel quantification converting maps into quantitative chemistry for geology, metallurgy, and QA/QC What Geological Samples and Ore Systems Can microXRF Analyze? Geological, Environmental & Industrial Systems. Atlas Apex supports mineral-scale analysis across: - USGS critical mineral systems (Ni, Cr, Co, REEs, P, Ti, PGEs) - Ultramafic and layered mafic intrusions - Porphyry, epithermal, and skarn systems - Metasomatic carbonate–silicate contacts - Mine tailings and beneficiation products - Cement, clinker, SCMs, refractories, and ceramics - Slags, process residues, and industrial by-products This versatility makes Atlas Apex suitable for government labs, mining companies, processing facilities, shared research centers, and industrial QA/QC labs. How Does microXRF Help Characterize Critical Minerals? From Occurrence to Process Behavior. Atlas Apex enables users to move beyond bulk assays by mapping critical metals and industrial elements directly within mineral and phase hosts—supporting both resource evaluation and process optimization. Representative Use Cases: - REE and critical metal phase association - Locked vs liberated metal identification - Alteration and reaction zoning - Feedstock and concentrate characterization - Processing, recovery, and performance optimization Why Is microXRF Useful for Geological and Critical Mineral Analysis? See Chemistry in Its Structural and Mineral Context. Bulk techniques such as XRF, ICP, and wet chemistry quantify elemental totals, but often remove spatial, textural, and phase context. In both natural resource systems and industrial materials, understanding where elements reside—in which minerals, phases, or microstructures—is essential. microXRF preserves spatial context, enabling direct visualization of elemental distributions across minerals, grains, inclusions, alteration fronts, reaction zones, and engineered phases. Key Advantages: - 5–10 µm spatially resolved elemental data - Direct visualization of critical minerals, REEs, and industrially relevant elements - Non-destructive workflows for high-value, limited, or archived samples - Minimal sample preparation compared to wet chemistry - Applicable to rocks, ores, concentrates, tailings, cement, ceramics, slags, and industrial solids
CATEGORY
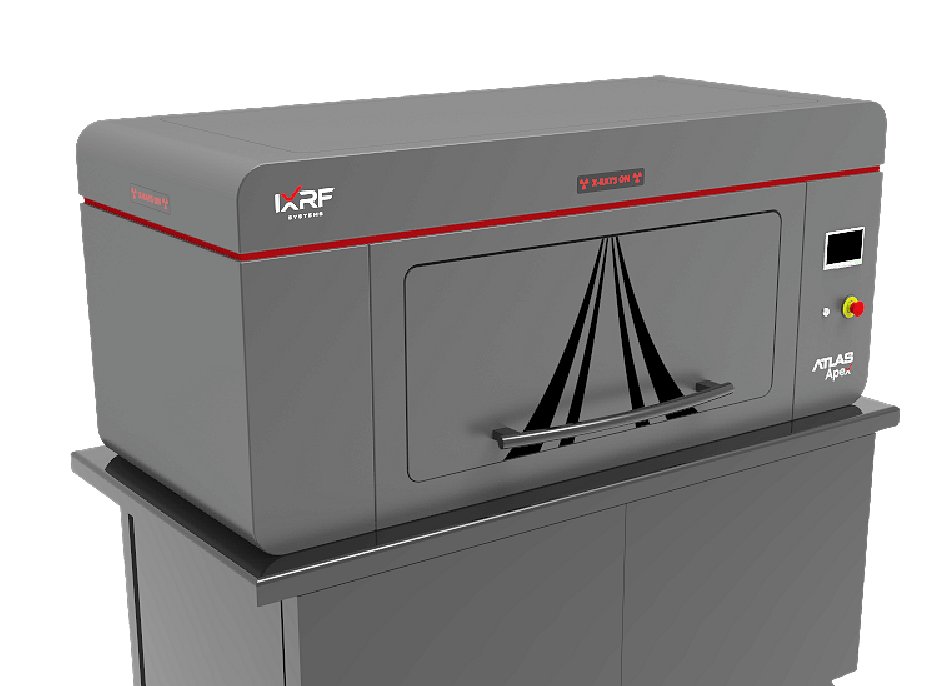
IXRF Systems’ ATLAS Apex X mainframe microXRF spectrometer is the latest general purpose, large chamber micro/small spot energy dispersive X-ray fluorescence (μXRF) spectrometer for the measurement and imaging/mapping of elements from carbon (C) through uranium (U). Designed to image and analyze a wide variety of sample types, ATLAS Apex X leads the industry in virtually every major specification category from the most powerful software and the largest detector active area, to our superior perpendicular geometry and tiny 5 μm diameter micro XRF spot. ATLAS Apex’ Iridium Ultra software platform, developed with SEM/EDX elemental mapping and analytical functionality, is unsurpassed in it’s ability to provide elemental and phase mapping, line scans, critical dimensions (CD) as well as qualitative and quantitative elemental analyses of solids, liquids, particles, powders and thin films. The functional, flexible, and feature-rich software suite guarantees unprecedented productivity. ATLAS Apex X is the microXRF (μEDXRF) elemental analyzer that leads the world with innovation. Biggest chamber ATLAS Apex X microXRF imaging spectrometer features the industry’s most voluminous sample chamber, allowing for automation of more samples, larger area mapping capabilities, and wider variability of sample types that can be analyzed. Sample chamber size: 940 x 660 x 355 mm (37 x 26 x 14 inches). The 5 micron advantage ATLAS Apex X microXRF mapping spectrometer is the mainframe tool of choice for sample characterization using small-spot micro X-ray fluorescence (microEDXRF) spectrometry for information on composition (phase) and elemental distribution. With the smallest X-ray spot in the industry at 5 microns, ATLAS Apex X is optimized for analysis speed without compromising accuracy. The instrument can measure a wide range of sample types, whether small or large, even or irregularly shaped. Equipped with a large high-speed stage, it supports analysis of virtually any kind of sample: solids, liquids, powders, thin-films and particles. Its extra large vacuum chamber delivers superior light element (low-Z) sensitivity down to carbon (C). When it comes to XRF microscopic imaging (mapping), smaller is always better. Above is a geologic thin section comparing (left to right) a 5µm beam with a 10µm and 20µm beam respectively. Superior geometry ATLAS Apex w/ 5 µm round spot - Perpendicular ATLAS Apex X geometry allows for circular excitation down to 5 microns for highest spatial resolution. - Competitor’s inferior angled geometry only allows smallest spot to be 25 microns due to the ellipse. Unmatched speed - Mix and match up to 4 Silicon Drift Detectors (SDD) for the largest possible solid angle collection efficiency - Up to 260 mm 2 area Energy resolution: ≤125 eV resolution - Highest count rate with the smallest spot for fast high-res images Mosaic automation - Stitches high-magnification overview camera images into a single, large-area composite - Enables full-sample visualization beyond the camera’s native field of view (13×10mm) - Supports acquisition at the highest available optical resolution for detailed inspection - Facilitates efficient navigation and region selection for automated analyses - Integrated with Atlas Automation to streamline sample setup and ROI definition Spot automation - Auto spectral spot analysis - Automated X-ray mapping - Automated linescans Intuitive software Beginner users will find the software simple to navigate in a comprehensive manner. As they advance, more powerful tools are easily accessible with no additional cost. They are all included and not added on as options: custom report generation, phase analysis, particle analysis and morphology. Sample types and conditions - Air, vacuum or helium atmosphere - Vacuum ready in under one minute - Allows, solids, liquids, powders, particles and multi-layer thin films Micro X-ray Excitation - 50 kV / 50 W / 1 mA Rh target (others available) X-ray tube - Polycapillary focusing optic - Filter wheel with up to 7 filters (plus open position) before the focusing optic - Available primary X-ray spot sizes: 5, 10, 15, 20, 25, 40, or 100 μm - An optional second X-ray tube, with a choice of anodes, is available with spot sizes of 200, 500, or 1000 μm X-ray detection - Mix and match up to 4 Silicon Drift Detectors (SDD) For increased precision and/or reduced acquisition times - 30 mm 2 to 65 mm 2 area Very close-coupled geometry - Energy resolution: ≤125 eV resolution - Peltier thermoelectric cooling Chamber and geometry - Chamber size: 950 x 650 x 365 mm (37 x 26 x 14 inches) - Top-down perpendicular geometry from tube to sample - Mapping area: 400 x 300 mm under automatic control - Sample view: 3 sample positioning and analysis cameras Samples may be positioned manually with the door open Largest precision stage - Motorized XY, Z optional Mapping travel: 400(X) x 300(Y) mm - Speeds up to 300mm/s Map acquisitions at ≤ 1ms/pixel - Accuracy < 1µm - Custom adapters available Iridium Ultra™ for Windows® 11 - X-ray fluorescence imaging spectroscopic software Fundamental Parameters (FP) For solids, liquids, powders, and particles - Thin film FP for up to 8 layers, including substrate - Automatic treatment for sum/escape peaks and deconvolution - Up to 8 acquisition conditions per analysis - EDXRF mapping and imaging, up to 9,998 × 9,998 pixels Every pixel is a full EDXRF spectrum Principal component analysis (PCA) for phase mapping - IU-GEOCHEM (Geological Elemental Observation and Characterization of High-Efficiency Mapping) Innovative mineral identification technology, comprehensive databases (4000 minerals) for quick and easy mineral identification Included with Iridium Ultra Acquisition and quantitation - One-click acquisition and automatic peak identification - Customizable identification, labeling, processing, and quantification - Scrolling periodic chart - Drag and drop overlay - Automatic overlap correction, sum/escape peak removal, background correction, and linear/non-linear deconvolution - Fundamental Parameters (FP) and Quantitative Match - Material classification database - Empirical analysis via least squares and Lucas Tooth Imaging and analysis - Optical Mosaic Resolution: Ultra-High Definition Mosaic (Up to 100 Megapixels) Mosaic resolution is user-configurable and limited only by storage capacity and stitching parameters - Multi-Point automated analysis directly from the image - Morphological processing for rapid feature size measurements - Image stitching and montage - Motorized zoom and focus control through software - Live imaging during stage movements - LED illumination with adjustable brightness - Integrated crosshair overlay for accurate alignment of analysis points and mapping areas - Imaging field of view matched to X-ray spot size for accurate correlation between optical and XRF data - Segmentation and feature segregation - Particle analysis package Including border removal, sorting and exclusion Classification by composition Mapping and linescans - Simultaneous acquisition of 35 elements - Stored spectral data for every pixel - Live spectrum display during acquisition - Single or multiple map acquisition from image Overview or spot camera - Map stitching and montage - Extract spectra from map: point, area, freehand - Create linescan from map - Mouse-over view intensities and concentrations - Phase Analysis - Multi-compositional map display Of element and compound ranges - Overlay linescans on image Specialty and automation - Multilayer thin film and coatings analysis up to 8 layers - Serpentine continuous mapping (dual directional mapping) - ASTM E2926-13 Glass Analysis - Track, store, and recall all stage locations and images Imaging / mapping flow - Create multiple X-ray maps on any region on the sample - Define map parameters directly from video image - Combine pixels to create analysis regions Regions are summed to create a composite spectrum - Automatically identify elemental peaks - Apply analytical quantification method - Analytical results are displayed as a graphic Top menu navigation - Beginner users find the software simple to navigate - Advanced users find that powerful tools are easily accessible - All software features are included standard - Custom report generation for completeness - An exhaustive tool set comes from scanning electron microscopy Spectral display features - One click operation for acquisition, automatic peak identification, and quantification - Collection of x-ray spectra into 25 individual windows - Point and click cursor displays energy, counts, and possible elements present - Customizable automatic element identification and labeling of peaks - Scrolling markers from element chart on spectra - Complete annotation tools for spectra; customize text, lines, and more Alignment laser / operation - Comprehensive software design - Laser alignment focusing As shown in the video image - Large high magnification video viewing - Easy to operate joystick - Sub-micron X-Y-Z stage - Alignment laser visible on concrete sample Automatic phase analysis - Phase analysis by Principle Component Analysis (PCA) - PCA is used in exploratory data analysis, an approach to analyzing data sets to summarize their main characteristics - PCA can be done on intensity or concentration based maps - Phases are defined and percent (%) of field of view of each phase is defined - In a PCA map, phases are marked by a defined color - IU-GEOCHEM (Geological Elemental Observation and Characterization of High-Efficiency Mapping) Innovative mineral identification technology, comprehensive databases (4000 minerals) for quick and easy mineral identification Imaging composition - User-defined compositions define the image - Maps can be defined by intensities or concentrations - Maps can be elements, compounds, components, materials, etc. Line profile analysis (linescan) - Relative elemental concentration or intensity along a line - Multiple charts display the “tiled” form of the data Relative change of each element is viewed separately - Linescans may also be displayed “stacked” for comparison Inset example shows an overlay of a long 300 mm linescan - Larger image is a 5 micron scan at ppm levels Morphology - Surface morphology is a evaluation of the shape of a surface - Particles, features, inclusions are elementally identified And automatically counted/measured by feature type - Additional data on each feature may be easily collected - As shown, an extensive set of image features is available ATLAS X features - Largest sample chamber in the industry - Spot size down to 5 microns with anti-halo optic - SDD detectors w/ active area up to 65 mm 2 - Edge-to-edge mapping of 300 mm wafers - 50 kV / 50 W polycapillary optic micro X-ray source - Multi-point/multi-area automation & mapping - Air, vacuum, helium for solids, liquids, and powders - Iridium Ultra software running on Windows™ 11 OS Specifications Elemental range: Fluorine (F) through Americium (Am). Carbon (C) through Americium (Am) on the LE version of Atlas Sample types: Solids, liquids, particles, powders and thin films Sample chamber size: 940 x 660 x 355 mm (37 x 26 x 14 inches) Analysis atmosphere: Air, vacuum or He(g) purge Primary X-ray source: 50 W max power, 50 kV @ 1 mA Optional secondary X-ray source: 4-12 W max power, 40-60 kV @ 0.4-1 mA X-ray source optics: Polycapillary or aperture collimation X-ray source anode: Rhodium (others optionally available) X-ray source spot size (primary): 5 μm standard (optional: 10, 15, 20, 25, 40, or 100 μm) X-ray source filters: Up to 7 plus an open position Primary X-ray source geometry: Top-down beam (perpendicular to sample stage) Detector(s): 1 standard, optionally up to a maximum of 4 Detector types: Silicon drift detector (SDD) with Graphine windows Detector active area: 30 to 65 mm 2, up to 260 mm 2 w/ 4 detectors Sample stage type: Motorized X,Y, and Z Sample stage travel: 600(W) x 300(D) x 210(H) mm Mapping travel: 300(X) x 400(Y) mm Mapping scan speed: 1-3 ms/pixel Stage XY speed: Up to 300 mm/s Sample view: 3 cameras for sample positioning and analysis Operating system: SFF PC w/ Microsoft® Windows™ 11 OS Analysis and control software: Iridium Ultra: provides complete control of parameters, filters, cameras, optical microscopes, sample illumination and positioning, and measurement media Quality and safety: CE marked, RoHS, radiation < 0.5 μSv/h Dimensions: 1690(L) x 787(W) x 1630(H) mm (67 x 31 x 64 inches) Power: 100-240 V, 1 phase, 50/60 Hz Periodic table - Quantify elements from carbon (C) through uranium (U) - In any sample type: solids, liquids, powders, particles, and thin films - From low parts-per-million (PPM) to 100 wt.% - Hyperspectral microscopic imaging where every pixel is a complete spectrum - Mapping, linescans, multi-point, and single-point quantification
CATEGORY
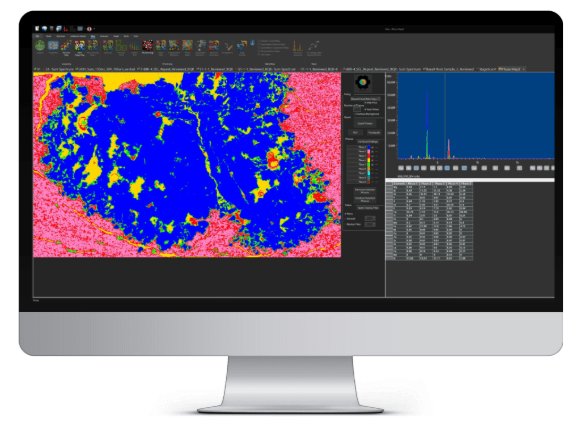
Hyperspectral XRF Mapping with Iridium Ultra Atlas Apex M is powered by Iridium Ultra™, IXRF’s in-house microXRF software platform for Windows® 11. Designed for both new and advanced users, Iridium Ultra integrates acquisition, spectral processing, quantitative analysis, hyperspectral XRF mapping, phase classification, image analysis, and reporting into a single workflow. With Iridium Ultra, every pixel in an XRF map contains a full energy dispersive X-ray fluorescence spectrum. This allows users to move beyond simple elemental images and interact directly with the spectral data behind each map, region, feature, particle, or line profile. Users can extract spectra from points, areas, or freehand regions; compare elemental distributions; generate quantitative maps; classify phases; and create application-ready reports from the same software environment. Quantitative microXRF Analysis Iridium Ultra simplifies microXRF acquisition while providing the analytical depth required for complex materials characterization. Users can perform one-click acquisition, automatic peak identification, and quantitative analysis while retaining full control over processing, labeling, calibration, and reporting. Key capabilities include: - Energy dispersive X-ray fluorescence software for microXRF and microEDXRF analysis - Fundamental Parameters analysis for solids, liquids, powders, and particles - Thin-film Fundamental Parameters analysis for up to 8 layers, including an infinite base or substrate - Up to 8 acquisition conditions per analysis - Automatic peak identification and customizable element labeling - Automatic overlap correction, background correction, sum peak treatment, escape peak treatment, and full spectral deconvolution - Empirical analysis using least squares and Lucas-Tooth methods - Quantitative Match and material classification database tools - Scrolling periodic table for fast element selection and spectral review - Drag-and-drop overlay tools for elemental image comparison - Custom report generation for documentation and data communication Elemental and Phase Mapping Iridium Ultra enables high-resolution hyperspectral XRF mapping where each pixel stores a complete XRF spectrum. This makes it possible to visualize elemental distributions, quantify regions of interest, identify small features, and explore complex sample heterogeneity with high spatial and chemical detail. Mapping and imaging capabilities include: - Hyperspectral EDXRF mapping and imaging up to 9,998 × 9,998 pixels - Full-spectrum data storage at every pixel - Simultaneous acquisition of up to 35 elements - Live spectrum display during acquisition - Single or multiple map acquisition from overview or spot camera images - Map stitching and montage for large-area elemental imaging - Point, area, and freehand spectrum extraction from maps - Linescan creation directly from map data - Mouse-over display of intensities and concentrations - Multi-compositional map display for elements, compounds, components, materials, and user-defined compositions - Elemental and compound range overlays - Linescan overlays on optical or elemental images Intuitive Interface with Advanced Analytical Depth Iridium Ultra is designed to be easy for new users to navigate while giving advanced analysts access to powerful microXRF tools without requiring separate software add-ons. Its top-menu navigation, one-click acquisition tools, spectral displays, image overlays, and automated reporting features help users move efficiently from sample setup to final results. User interface features include: - Top-menu navigation - One-click acquisition, peak identification, and quantification - Spectral display with up to 25 individual spectrum windows - Point-and-click cursor display of energy, counts, and possible elements - Customizable automatic element identification and peak labeling - Scrolling element markers from the periodic table - Complete spectrum annotation tools, including customizable text and lines - Drag-and-drop overlays for rapid elemental image comparison - Standard inclusion of advanced tools without additional software options Mosaic Imaging and Automated ROI Selection Iridium Ultra includes high-resolution optical imaging tools that support sample navigation, region selection, and correlation between optical features and XRF data. Mosaic navigation stitches high-magnification overview images into a single large-area composite, giving users a clear visual reference for defining analytical regions across the sample. Mosaic and optical imaging tools include: - Ultra-high-definition optical mosaic imaging up to 100 megapixels - User-configurable mosaic resolution, limited by storage capacity and stitching parameters - High-magnification image stitching and montage from the overview camera - Full-sample visualization beyond the native 13 × 10 mm camera field of view - Multi-point automated analysis directly from the image - Motorized zoom and focus control through software - Live imaging during stage movement - Adjustable LED illumination - Integrated crosshair overlay for accurate alignment of analysis points and mapping areas - Imaging field of view matched to X-ray spot size for accurate optical-to-XRF correlation - Streamlined ROI definition through integration with Atlas Automation Phase Analysis and Mineral Identification For geological and materials research, Iridium Ultra includes advanced tools for phase analysis, mineral identification, and compositional classification. Principal Component Analysis can be applied to intensity-based or concentration-based maps to help identify chemically distinct regions and visualize phase distributions across the field of view. Phase and mineral analysis capabilities include: - Principal Component Analysis for exploratory phase mapping - PCA analysis using intensity maps or concentration maps - Color-coded phase maps for visual classification - Percent field-of-view calculation for each identified phase - Multi-compositional map display for elements, compounds, and materials - IU-GEOCHEM: Geological Elemental Observation and Characterization of High-Efficiency Mapping - Mineral identification supported by a comprehensive database of approximately 4,000 minerals - Fast classification of mineral phases from hyperspectral microXRF data Composition Imaging Analysis - User-defined compositions define the image - Maps can be defined by intensities or concentrations - Maps can be elements, compounds, components, materials, etc. Linescan Profile Analysis Iridium Ultra supports detailed line profile analysis for evaluating relative elemental intensity or concentration changes across a defined path. Linescans can be used to investigate interfaces, coatings, diffusion zones, compositional gradients, phase boundaries, and long-distance elemental variation. Linescan capabilities include: - Relative elemental concentration or intensity along a selected line - Separate display of each element for clear trend analysis - Tiled or stacked chart views for comparison - Overlay of linescan data on optical or elemental images - Support for long linescans across large sample areas - High-resolution analysis of ppm-level features, depending on sample, configuration, and acquisition conditions Particle and Feature Analysis Iridium Ultra includes morphology and particle analysis tools that allow users to identify, count, measure, classify, and evaluate features based on both image characteristics and elemental composition. This is especially useful for particles, inclusions, contamination, defects, and other discrete features in complex samples. Morphology and particle analysis tools include: - Segmentation and feature segregation - Particle analysis package with border removal, sorting, and exclusion - Classification by composition - Rapid feature size measurements - Elemental identification of particles, inclusions, and surface features - Automated counting and measurement by feature type - Additional data collection from selected features - Extensive image analysis tools adapted from advanced microscopy workflows Developed In-House in Austin, Texas Iridium Ultra is written and supported in-house by IXRF Systems in Austin, Texas. Because the hardware, software, and application support are developed together, Atlas Apex M users benefit from an integrated microXRF platform designed for practical laboratory workflows, advanced elemental mapping, and long-term analytical flexibility.
CATEGORY
