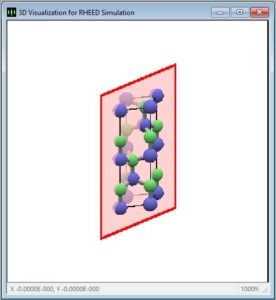
The power of RHEED at your fingertips, combined with k-Space simulation software. Simulate and visualize RHEED patterns with expressive and intuitive controls. kSA RHEEDSim™, the new RHEED simulation software from k-Space, gives you full control over the key parameters that dictate changes in your RHEED pattern. It’s a powerful visual tool you can start using immediately. Render RHEED patterns for arbitrary crystal surfaces. Define the crystal surface and your experimental parameters, including the screen size and position, image resolution, electron beam energy, and more. kSA RHEEDSim™ renders the predicted pattern based on the physics that govern the electron beam diffraction at the surface. - Simulate RHEED patterns based on the crystal surface and other experimental parameters. Both 2D and 3D diffraction can be simulated. - Visualize the surface and bulk crystal to help understand the mechanisms of RHEED. - Control key parameters to observe their impact on the RHEED pattern. - Keep control over all parameters within easy reach with a compact interface. - Available as a standalone application or integrated with the kSA 400 Analytical RHEED System. - Use the included command line interface to quickly generate a range of simulated images. Simulate RHEED patterns for a broad range of crystal surfaces with complete control over the parameters that affect the pattern. Easily and rapidly produce RHEED patterns and different visualizations to explore and understand the behavior of RHEED under different conditions. Among the features of kSA RHEEDSim™: Visualize the 3D structure of the simulated surface. - Visualize the 2D surface structure relative to the incident electron beam. See it update live as parameters are changed. - Visualize the 3D crystal structure for predefined or generated presets. - Approximate the effect of surface reconstruction. - Load a large variety of pre-set crystal surfaces. - Define new surfaces to simulate from bulk crystal data loaded from CIF files or generated manually. - Any CIF file describing a uniform crystal can be easily uploaded and cut along any surface plane to simulate new RHEED patterns. - Overlay your simulation output with other RHEED image data. - Perform dynamic simulations of changing phenomena. - Simulate a 500×500 output pattern in ~100 ms. - Choose from a selection of color palettes to customize the RHEED image output. - Can simulate changing incident angle easily using “Parameter Sweep” simulation mode. - Included command line interface lets you quickly generate simulated images with a few keystrokes, such as: ksa_rheedsim –crystal GaAs –plane 110 –outpath GaAs_110.png. Useful for building AI/ML training datasets. - Save all outputs and visualizations as images or in kSA image/movie formats using the kSA 400. Visualize the 3D unit cell and surface plane while defining new presets to easily reproduce your surfaces. 2D visualization for RHEEDSim of GaAs kSA RHEEDSim™ is capable of simulating any crystal surface that can be defined by a periodic 2D surface lattice. Simulation possibilities range from basic simulated RHEED patterns of common structures, to complex patterns produced by reconstructions or complex surfaces, to dynamic simulations of changing phenome
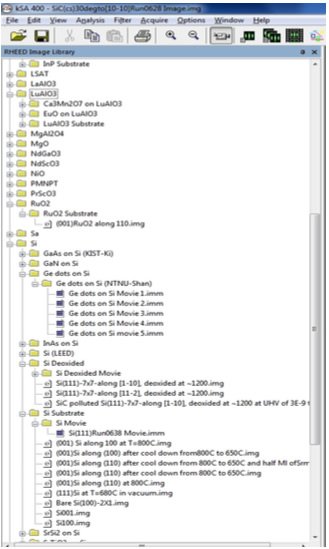
Save time and gain insight into your thin film growth with industry leading RHEED analysis The kSA 400 analytical Reflection High-Energy Electron Diffraction (RHEED) system puts the power of RHEED at your fingertips. Whether analyzing a static diffraction pattern or acquiring data at multiple azimuths during substrate rotation, the kSA 400 makes quantitative RHEED analysis easy. Exploit the power of RHEED with the kSA 400! The kSA 400 combines a high-resolution, high-speed, and high-sensitivity camera with sophisticated RHEED-specific acquisition and analysis software. This flexible system enables the analysis of virtually any image feature and, with one of many additional options, controls the electron gun for such tasks as acquiring RHEED rocking curves. Easy to use and straightforward to install, the kSA 400 is designed for convenience and gives quantitative results right out of the box. Seamless integration between hardware and software as well as visually-driven RHEED pattern analysis, makes user operation straightforward and simple. Extensive customer input has helped us make the kSA 400 the industry’s most powerful analytical RHEED system and an integral part of MBE, PLD, PVD, and surface science chambers worldwide. Growth Rate The most common use of RHEED is for determining growth rate via RHEED intensity oscillations, a phenomena that occurs during layer-by-layer epitaxial growth. The kSA 400 determines growth rate via three complimentary methods: Fourier-transform, extrema count (derivative analysis), and damped sine wave fitting. These three techniques determine growth rate independently, resulting in very accurate and consistent measurement of your thin-film growth rate. Watch the kSA 400 monitor RHEED oscillations. Lattice Spacing/Strain Another powerful use for RHEED is to determine the absolute atomic spacing, or lattice spacing, between atoms on a surface. The kSA 400 makes measuring absolute lattice spacing simple. Furthermore, if you’d like to measure the evolution of lattice spacing, or the strain of lattice mismatched growth, the kSA 400 makes this easy too. By monitoring the spacing between diffraction streaks using sophisticated, proven analysis algorithms, strain evolution with very high accuracy and resolution is at your fingertips with the kSA 400. Structural Analysis The kSA 400 makes analyzing surface structure easy. By acquiring RHEED images along the major crystal directions of the surface, measuring the pixel spacing and calculating a ratio, surface crystal structure can easily be determined. The kSA 400 also makes acquiring and archiving RHEED patterns a snap. The kSA 400 software contains a comprehensive RHEED Image Library (RIL) for reference and further analysis. The kSA 400 is the most advanced, full featured RHEED data acquisition and analysis package available. With a long list of capabilities, and available plug-in options, the kSA 400 offers the most insight from RHEED patterns. The kSA 400 RHEED analysis software has camera control options; data acquisition modes; acquisition, image analysis, data analysis, and export capabilities
CATEGORY
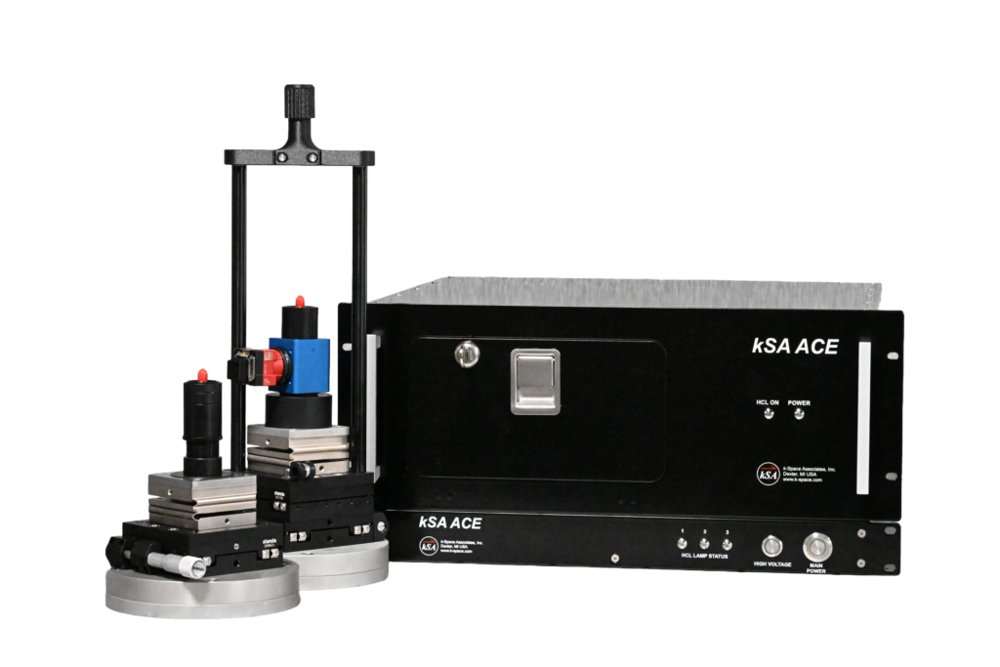
Atomic Flux Control: Accurate and High-Resolution Flux and Growth Rate Monitoring kSA ACE provides atomic flux control with accurate and high-resolution source flux and growth rate monitoring for thin-film deposition. The kSA Atomic Control for Epitaxy (ACE) metrology tool is a highly sensitive instrument that measures the in situ flux rate of atomic species using the principle of atomic absorption spectroscopy. The kSA ACE system uses conventional hollow cathode lamps (HCLs) to generate the atomic emission for the elements of interest. It also utilizes a high-sensitivity, UV-optimized solid-state spectrometer to monitor the absorption, along with a second spectrometer to monitor signal drift from the HCLs. Because the technique is inherently material specific, the signal does not respond to other species or radiation in the chamber. kSA ACE can measure each material of interest independently with high accuracy, providing precise material-specific flux control in multi-source deposition processes. With its high sensitivity and long-term repeatability under continuous operation, kSA ACE has applications in the fabrication of III-V and II-VI compounds, semiconductor devices, thin-film sensors, solar cells, optical coatings, x-ray optics, flat-panel displays, and more. A schematic of the atomic absorption spectroscopy technique for monitoring source flux. The kSA ACE instrument combines the atomic emission lines of up to three hollow cathode lamps (HCLs) into a colinear beam. The beam is split into a reference channel and a signal channel. The system continuously monitors both the reference and the signal channels with high-sensitivity, high-spatial-resolution spectrometers that monitor up to three elements simultaneously. The reference channel provides continuous correction for HCL intensity fluctuation. The signal beam is fiber coupled to lens cells on the process chamber and then passed through the flux of the deposition sources, resulting in attenuation of the atomic lines, specific to the resonant absorption of the atom species. The attenuation is proportional to the atomic density within the volume of the signal channel beam. The system also includes a Xe flash lamp, colinear with the HCL beam path, to correct for viewport coating. The entire optical subsystem, including HCLs, beam collimation optics, and spectrometers, is temperature stabilized, to ensure long-term stability and accuracy. kSA ACE electronics rack, optics rack, collection optics head, and emission optics head. Above Left: Light source optics head attached to chamber. Above Right: Detector optics head attached to chamber. Another useful feature of the system is the integrated camera that captures live video of the AA light spot as it looks once it has traversed the deposition path. This real-time imaging of the light spot allows for easy alignment of the tool, tracking of any spot drift, and characterization of the spot profile. Optionally, servo motors can be installed on the detector for real-time centering of the AA spot, minimizing any optical drift of the system. k-Space designed the kSA ACE using feedback from industry-leading scientists. The system is engineered to operate up to three sources at the same time with exceptional stability. k-Space can design systems to meet your specific needs, with options such as automated alignment drift compensation and motorized auto-alignment correcting light source optics heads. With kSA ACE, you can measure and control: - Real-time flux transmission/absorption - Real-time growth rate - Real-time composition control
CATEGORY
Wafer and Thin-Film Temperature Monitor – Go Where Pyrometers Can’t! Real-time absolute temperature measurement of standard semiconductor substrates like GaAs, InP, and Si, as well as wide bandgap substrates transparent in the IR (including GaN, SiC, ZnO, AlN, Ga2O3 and SrTiO3). Go where pyrometers can’t! The kSA BandiT is a non-contact, non-invasive, real-time, absolute wafer and thin-film temperature monitoring tool used during thin-film deposition and thermal processing. Using the temperature-dependent optical absorption edge inherent in semiconductor materials, kSA BandiT provides semiconductor temperature monitoring in ranges that pyrometers cannot measure: substrates transparent in the infrared (including GaN, SiC, ZnO, AlN, Ga2O3 and SrTiO3), as well as low temperature monitoring, e.g. low temperature GaAs, InP, and Si deposition. This includes room temperature wafer measurements. Furthermore, kSA BandiT is immune to changing viewport transmission, stray light, and signal contribution from substrate or source heaters, all sources of measurement error for pyrometers. Combined with its patented blackbody emission monitor, kSA BandiT has the ability to monitor the full range of temperatures for most substrate materials, including low band-gap substrates and metal films. Finally, because kSA BandiT uses a solid-state spectrometer, real-time film thickness and surface roughness can also be measured. Band Edge Temperature/Thermometry (BET) The most common application of the kSA BandiT tool is for direct substrate temperature measurement. By measuring the position of the substrate absorption edge, the absolute temperature of the wafer can be determined. This absorption edge, which is directly proportional to the band gap of the material, is temperature dependent. It is this temperature dependence that we rely on to determine the wafer temperature. A solid-state spectrometer is used to acquire either diffusely reflected, or transmitted light from the wafer. This spectra is then analyzed in real-time by the kSA BandiT software, fitting to the absorption edge, and determining the absolute wafer temperature from the position of the absorption edge. Blackbody Temperature Measurement In addition to kSA’s patented band edge temperature measurement, BandiT offers a complimentary measurement technique, blackbody temperature measurement. This approach, also patented by k-Space, fits the radiation emitted from the wafer to Planck’s equation. In this approach, the emissivity of the wafer can be changing, without affecting the temperature measurement. This is because it is the functional shape of the blackbody spectra, not its amplitude, that dictates the temperature of the emitting material. This is unlike pyrometry, which relies solely on the absolute signal level in a given (small) wavelength range. The kSA BandiT blackbody temperature measurement is typically used when the band edge of the material cannot be measured. This occurs typically when looking at a non-semiconductor substrate, a heavily doped substrate, or a very narrow band gap substrate (e.g. Ge or InAs). The blackbody temperature measurement technique typically has a lower limit in temperature of ~ 250 °C, due to limited emitted radiation at low temperatures. Film Thickness and Roughness Measurement Because a solid-state spectrometer is used with the kSA BandiT system, the full diffuse spectra is obtained. This spectra contains a wealth of information in addition to the material absorption edge. By analyzing the below gap interference fringes, the total film thickness can be very accurately determined. By analyzing the above gap scatter signal, changes in roughness can be easily monitored. Combined with real-time temperature measurement, kSA BandiT offers a very powerful in situ monitoring tool for your thin-film deposition and processing needs.
CATEGORY
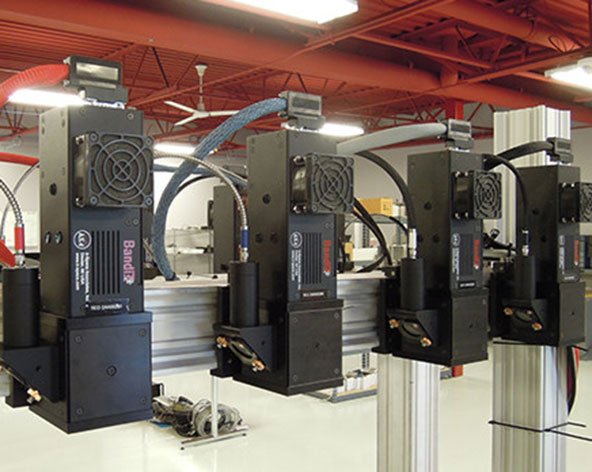
In-line PV Process Monitoring to Increase Performance and Yield Improve your process control with this patented technology. Measure and control uniformity, thickness, band gap, temperature, surface roughness and more. k-Space manufactures state-of-the-art in situ, real-time thin-film deposition monitoring tools, and has over 25 years of experience in the thin-film metrology field. The application of these proven kSA technologies to in-line PV manufacturing was a natural extension of our product line, as the most promising PV materials are based on thin-film semiconductor materials. Thin-film thickness, uniformity, band gap, and other physical properties are all critical parameters which influence PV device performance and can now be measured during the process. kSA BandiT PV technology is based on real-time spectroscopy of diffusely reflected light from a semiconductor as measured in-line during PV panel manufacturing. A broadband light source supplies the light which is focused onto the sample. The diffusely reflected light is then collected at a non-specular angle using a lens system. The light is coupled to a high-speed, solid-state spectrometer which is then analyzed in real-time for isolating optical metrics of interest. kSA BandiT PV is applicable to materials which are deposited onto glass, metal back-coated, flexible, or directly onto semiconductor substrates. All components used are solid state, with no moving parts, to ensure highest performance and reliability. Key parameters which are measured by BandiT PV to increase performance and yield are: Optical Band Gap Knowledge of the wavelength of the absorption edge (Optical Band Gap) is critical to understanding the performance of photovoltaic materials. This parameter is found by analyzing the absorbed and transmitted light signature of the material to observe the material’s transition from absorbing to transparent. kSA BandiT PV and has demonstrated the capability to measure this the optical band gap for the major PV materials being manufactured today, including cadmium sulfide (CdS), cadmium telluride (CdTe), and copper indium gallium diselenide (CIGS). Optical Absorption Profile In addition to providing important optical band gap information in real-time, kSA BandiT PV can also analyze and compare the actual optical absorption shape/slope profile of the material. With this method, the absorption spectra vs. wavelength can be monitored and tuned for abruptness of the interface at the optical band gap. In this fashion, the materials properties can be modified to provide the desired optical characteristics through process tuning or heat treating. Sample Temperature The measured optical band gap of a semiconductor has a nearly linear dependence on temperature. This temperature dependence forms the basis of band-edge thermometry (BET), which has been utilized in the kSA BandiT semiconductor temperature measurement systems. kSA band-edge based technology relies upon the direct semiconductor optical absorption shift with temperature (band gap dependence on temperature). By fitting the optical absorption edge of the semiconductor in real time and using substrate-specific, kSA-generated calibration files, measurement accuracy and repeatability are guaranteed and unmatched by any other optical temperature monitoring technique. Blackbody Emission Monitoring kSA BandiT also combines a new, patented Blackbody emission monitoring technology whereby the spectral radiation intensity of a sample is fit in real time to Planck’s equation to determine temperature. This technique is used for direct temperature measurement of the metal foil or film befor
CATEGORY
